Fleet Director Concept
Reimagining how fleet directors interact with fleet data — from a dashboard organized around data categories to one organized around the goals a director actually sets.
- My role
- Product Designer exploring future-state concepts alongside design leadership to help define the long-term vision for GM's commercial platform.
- Product
- GM Fleet Platform
- Status
- Conceptual — informing long-term vision
An intentionally open-ended brief.
Two years ago, my manager at the time and I were asked to explore what a "fleet intelligence" layer could look like for fleet directors — the people overseeing large, multi-region fleet operations.
The brief was intentionally open-ended. There were no requirements, no backlog, and no expectation that anything would immediately ship — just an invitation to explore how data and insights could help these users make better financial and operational decisions.
Goals kept losing to more data.
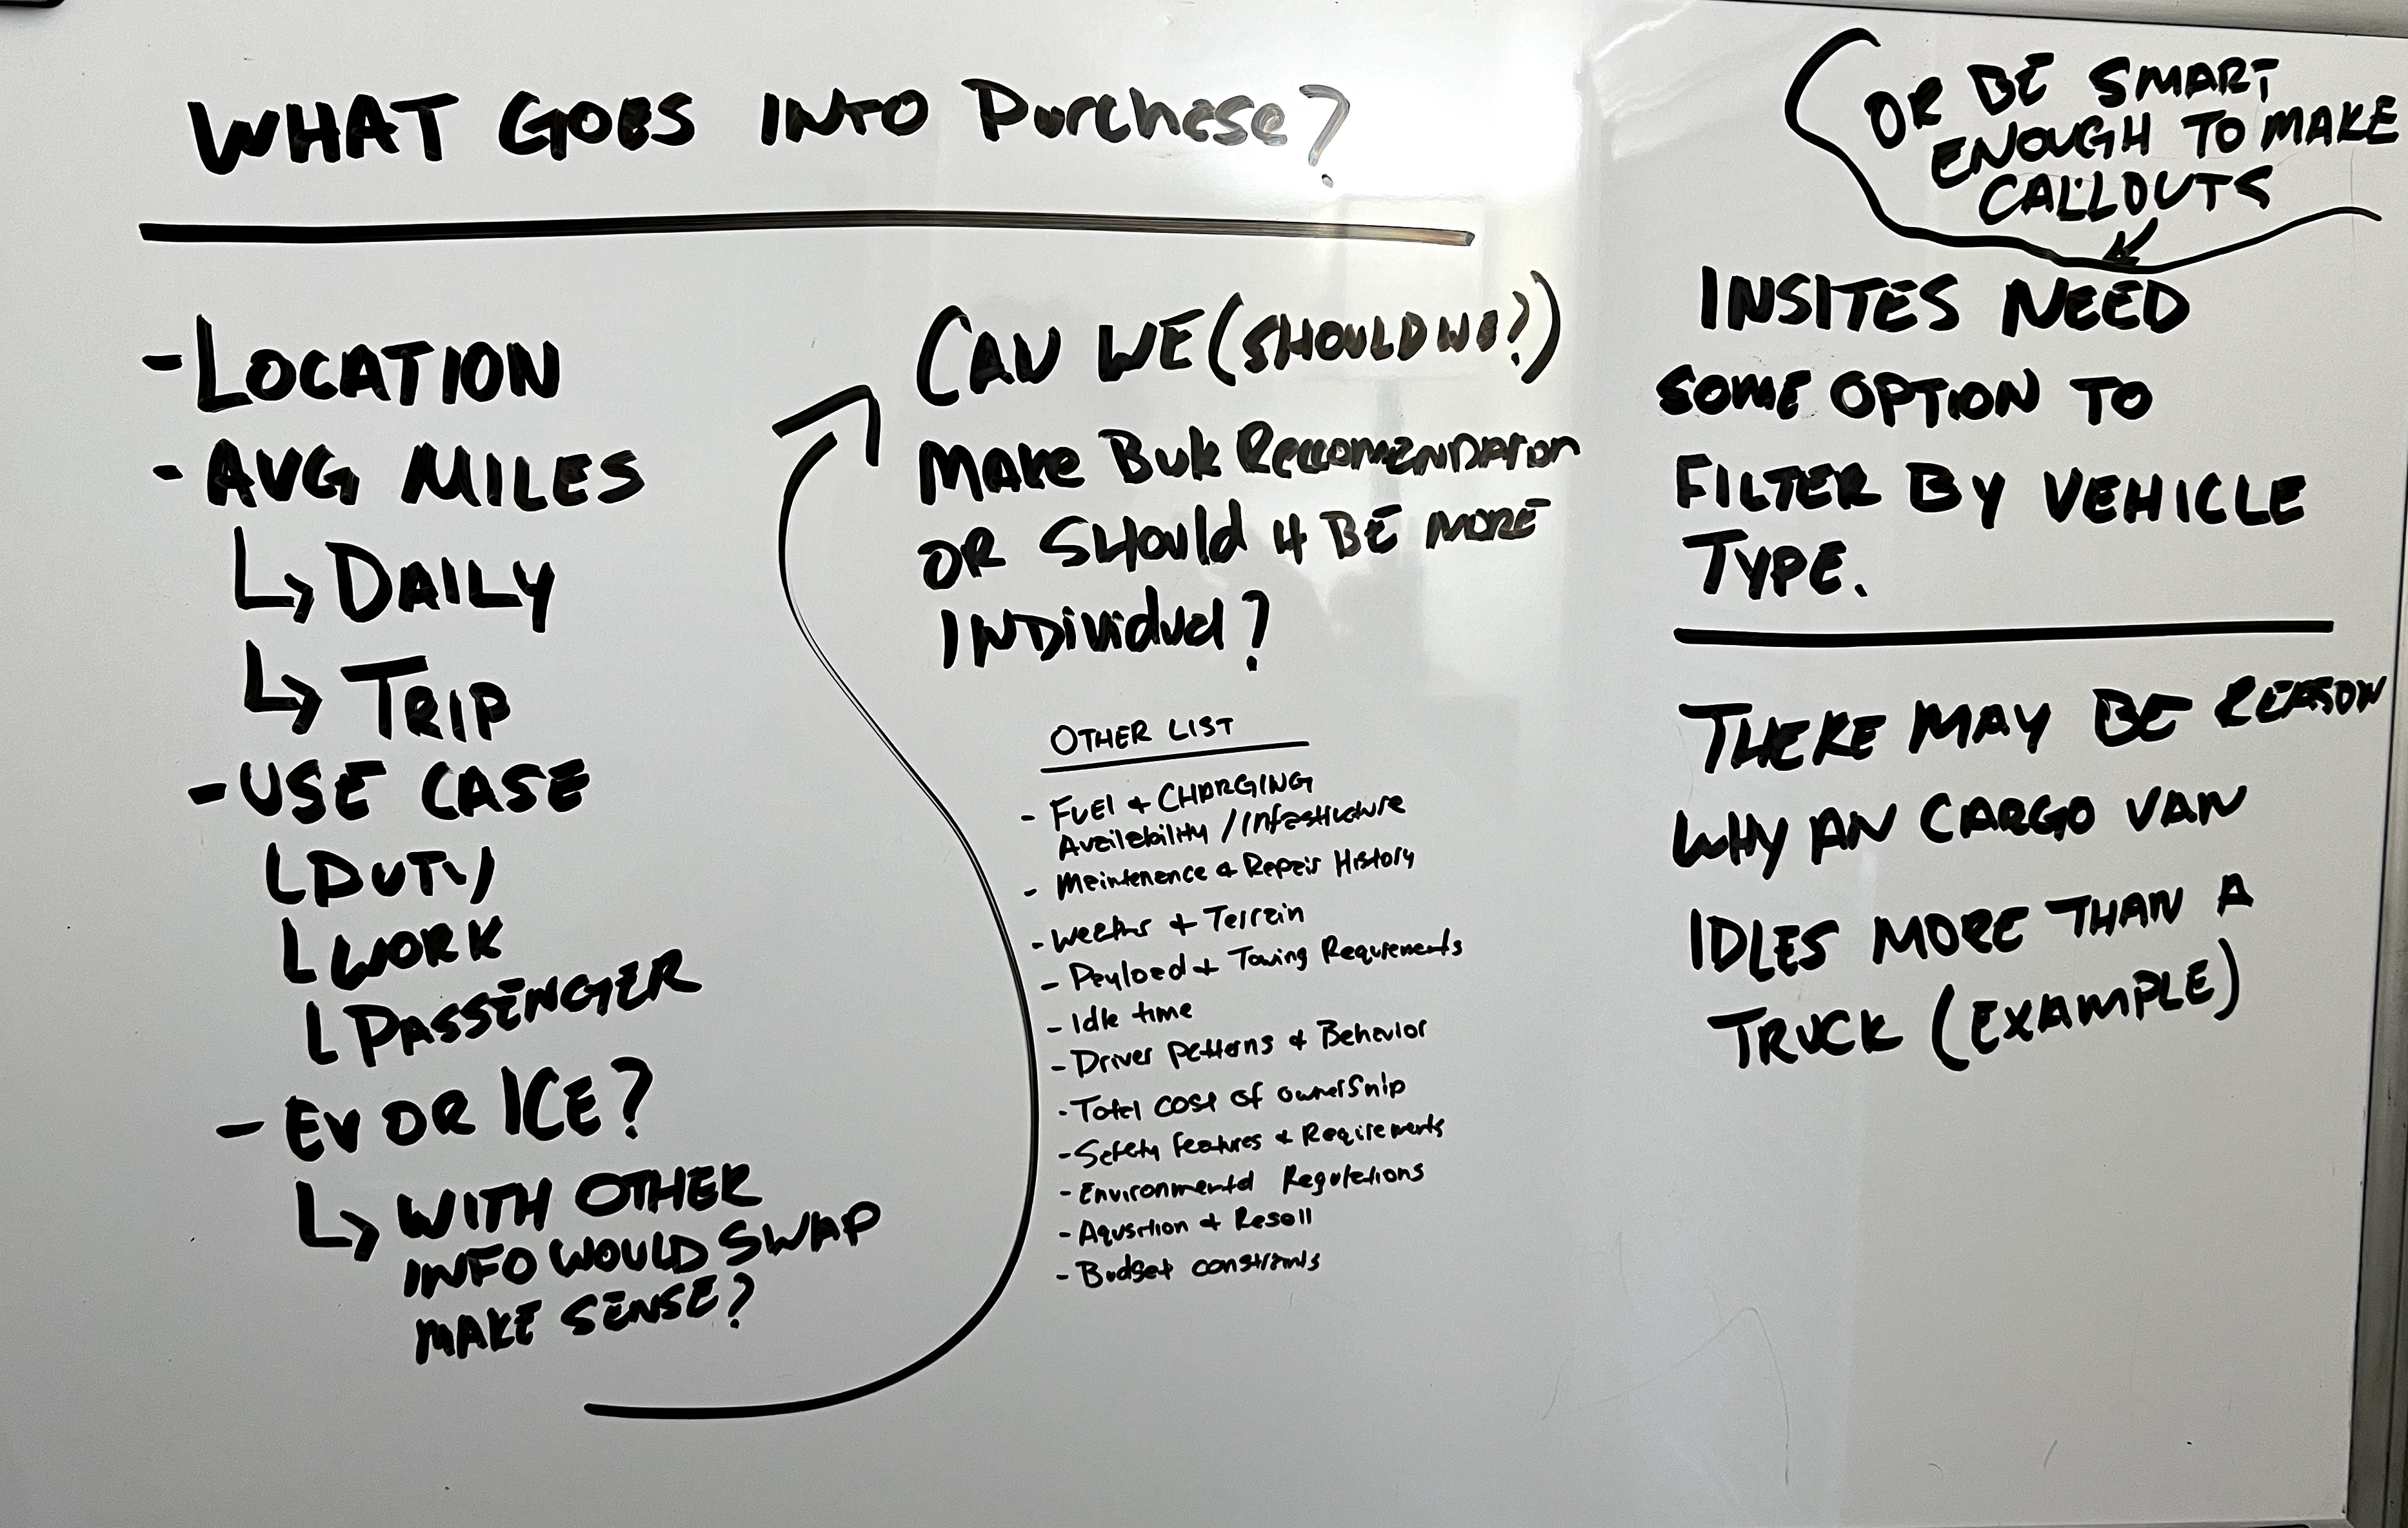
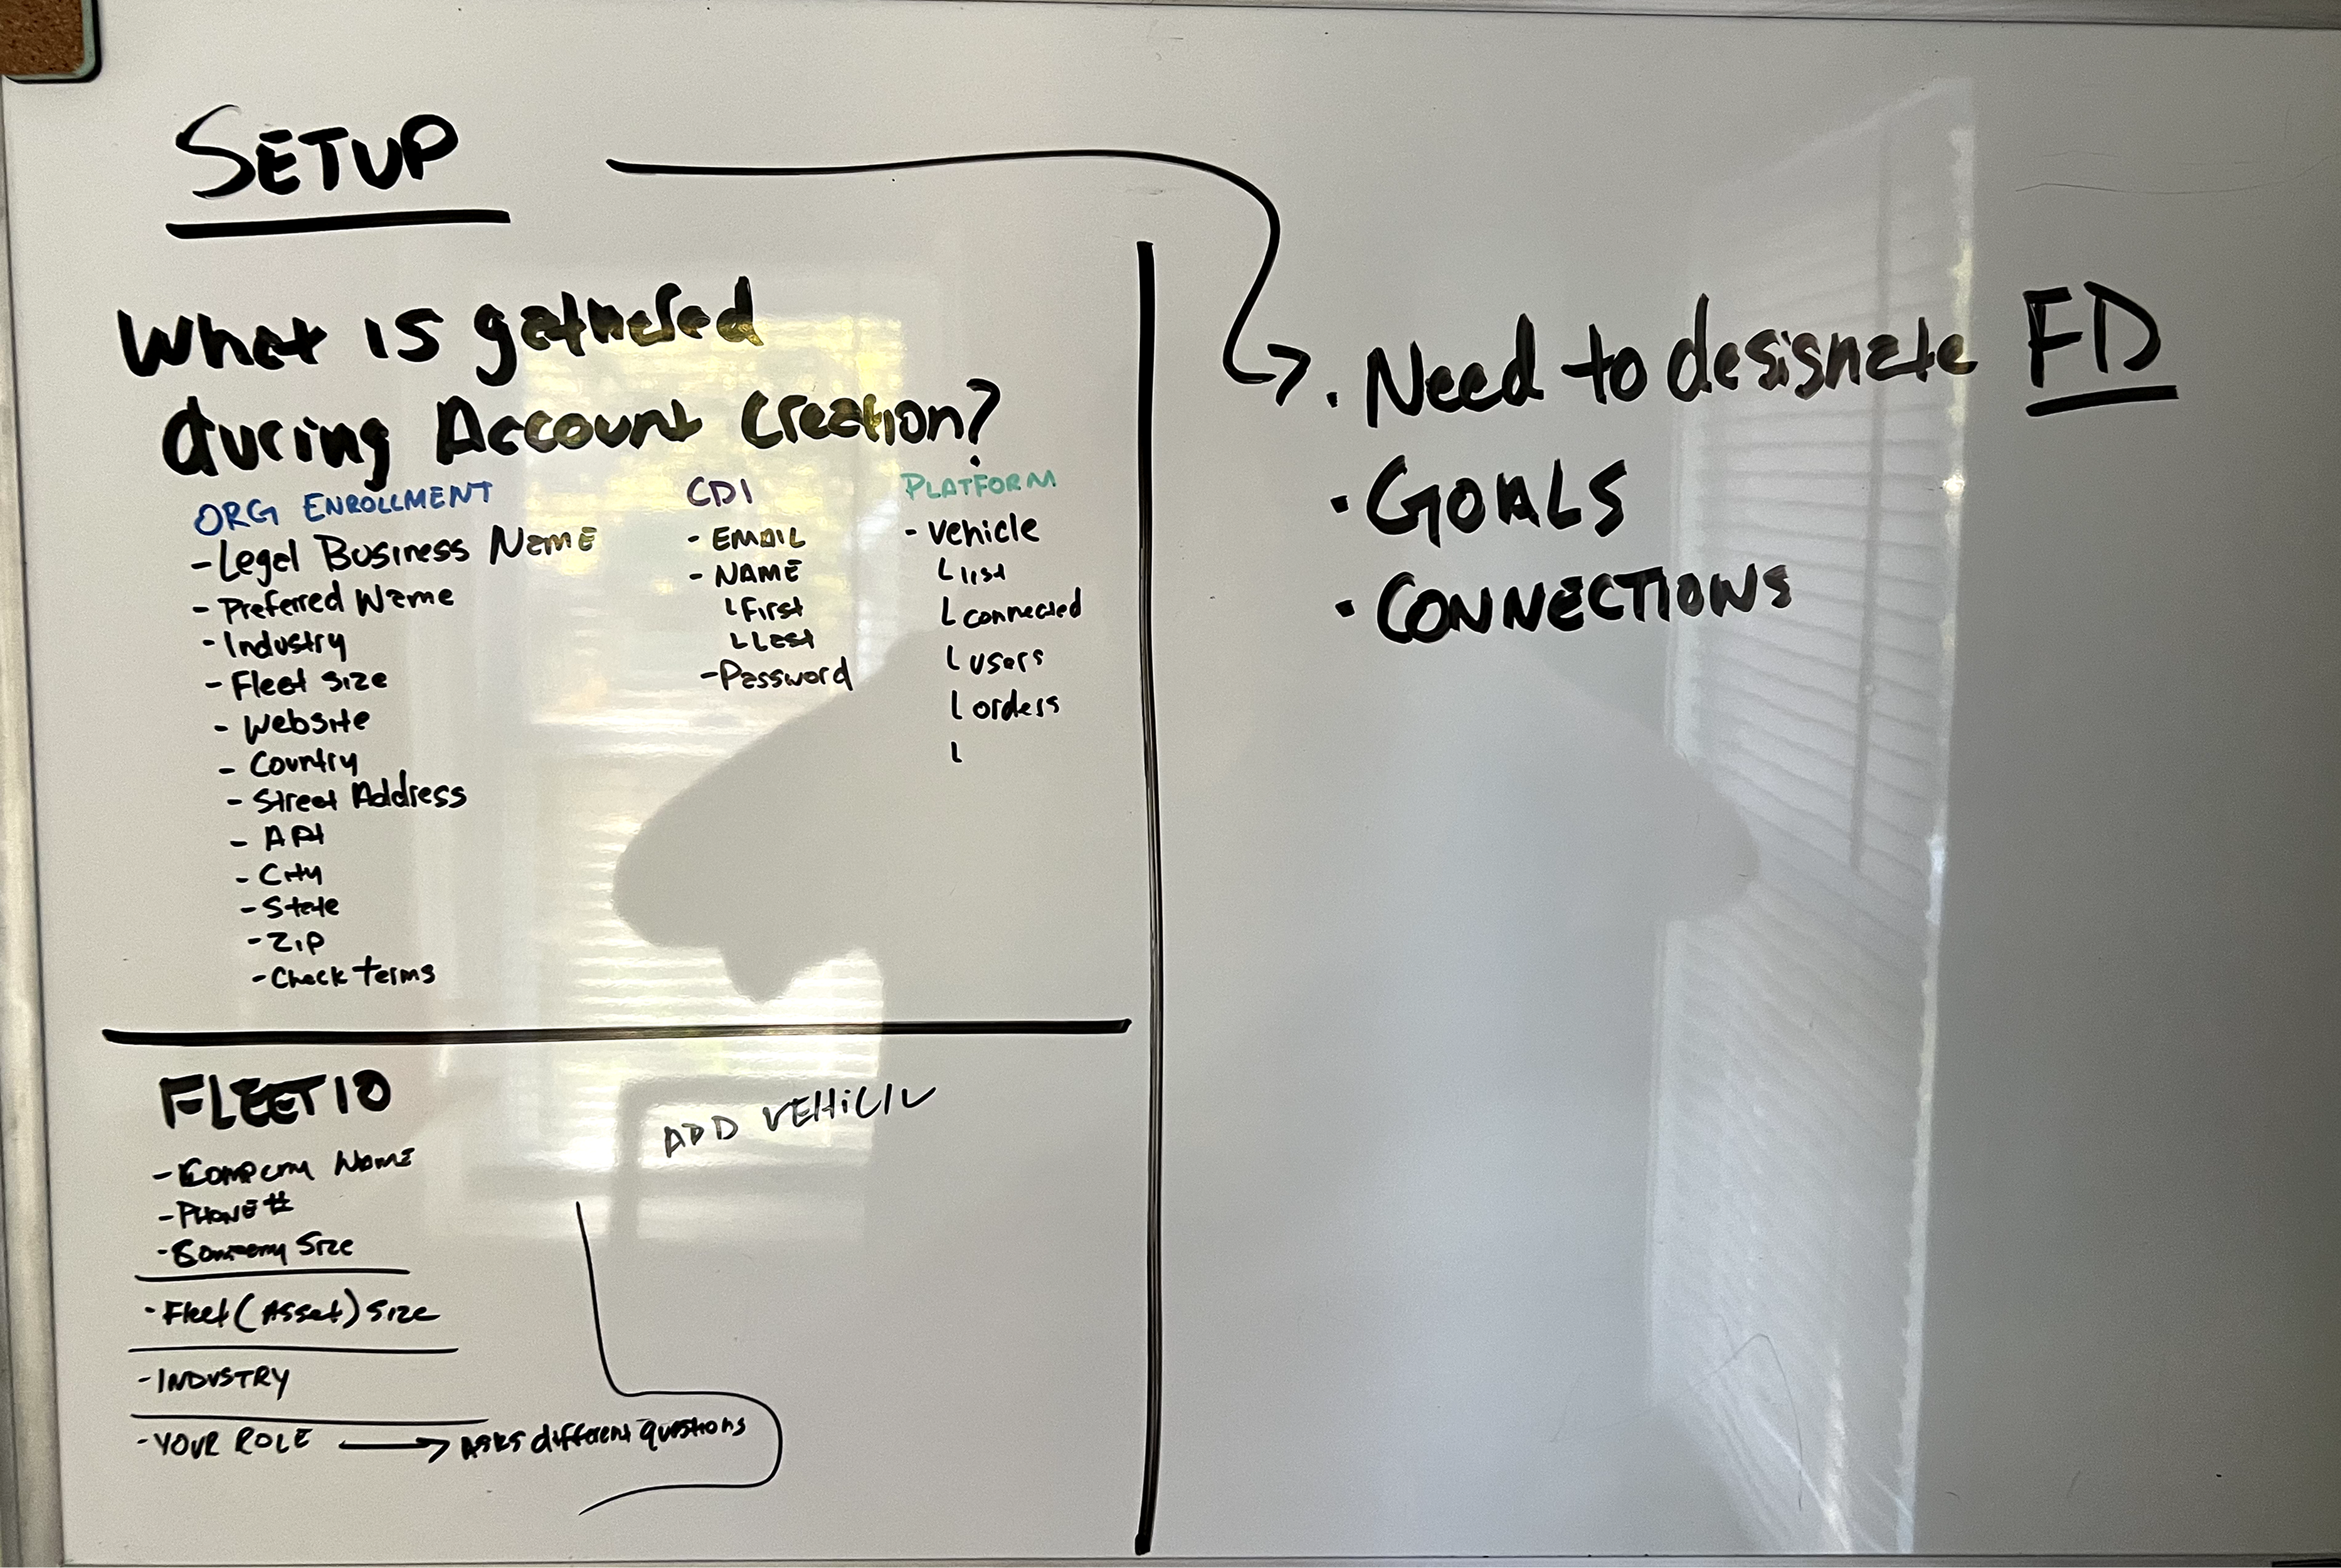
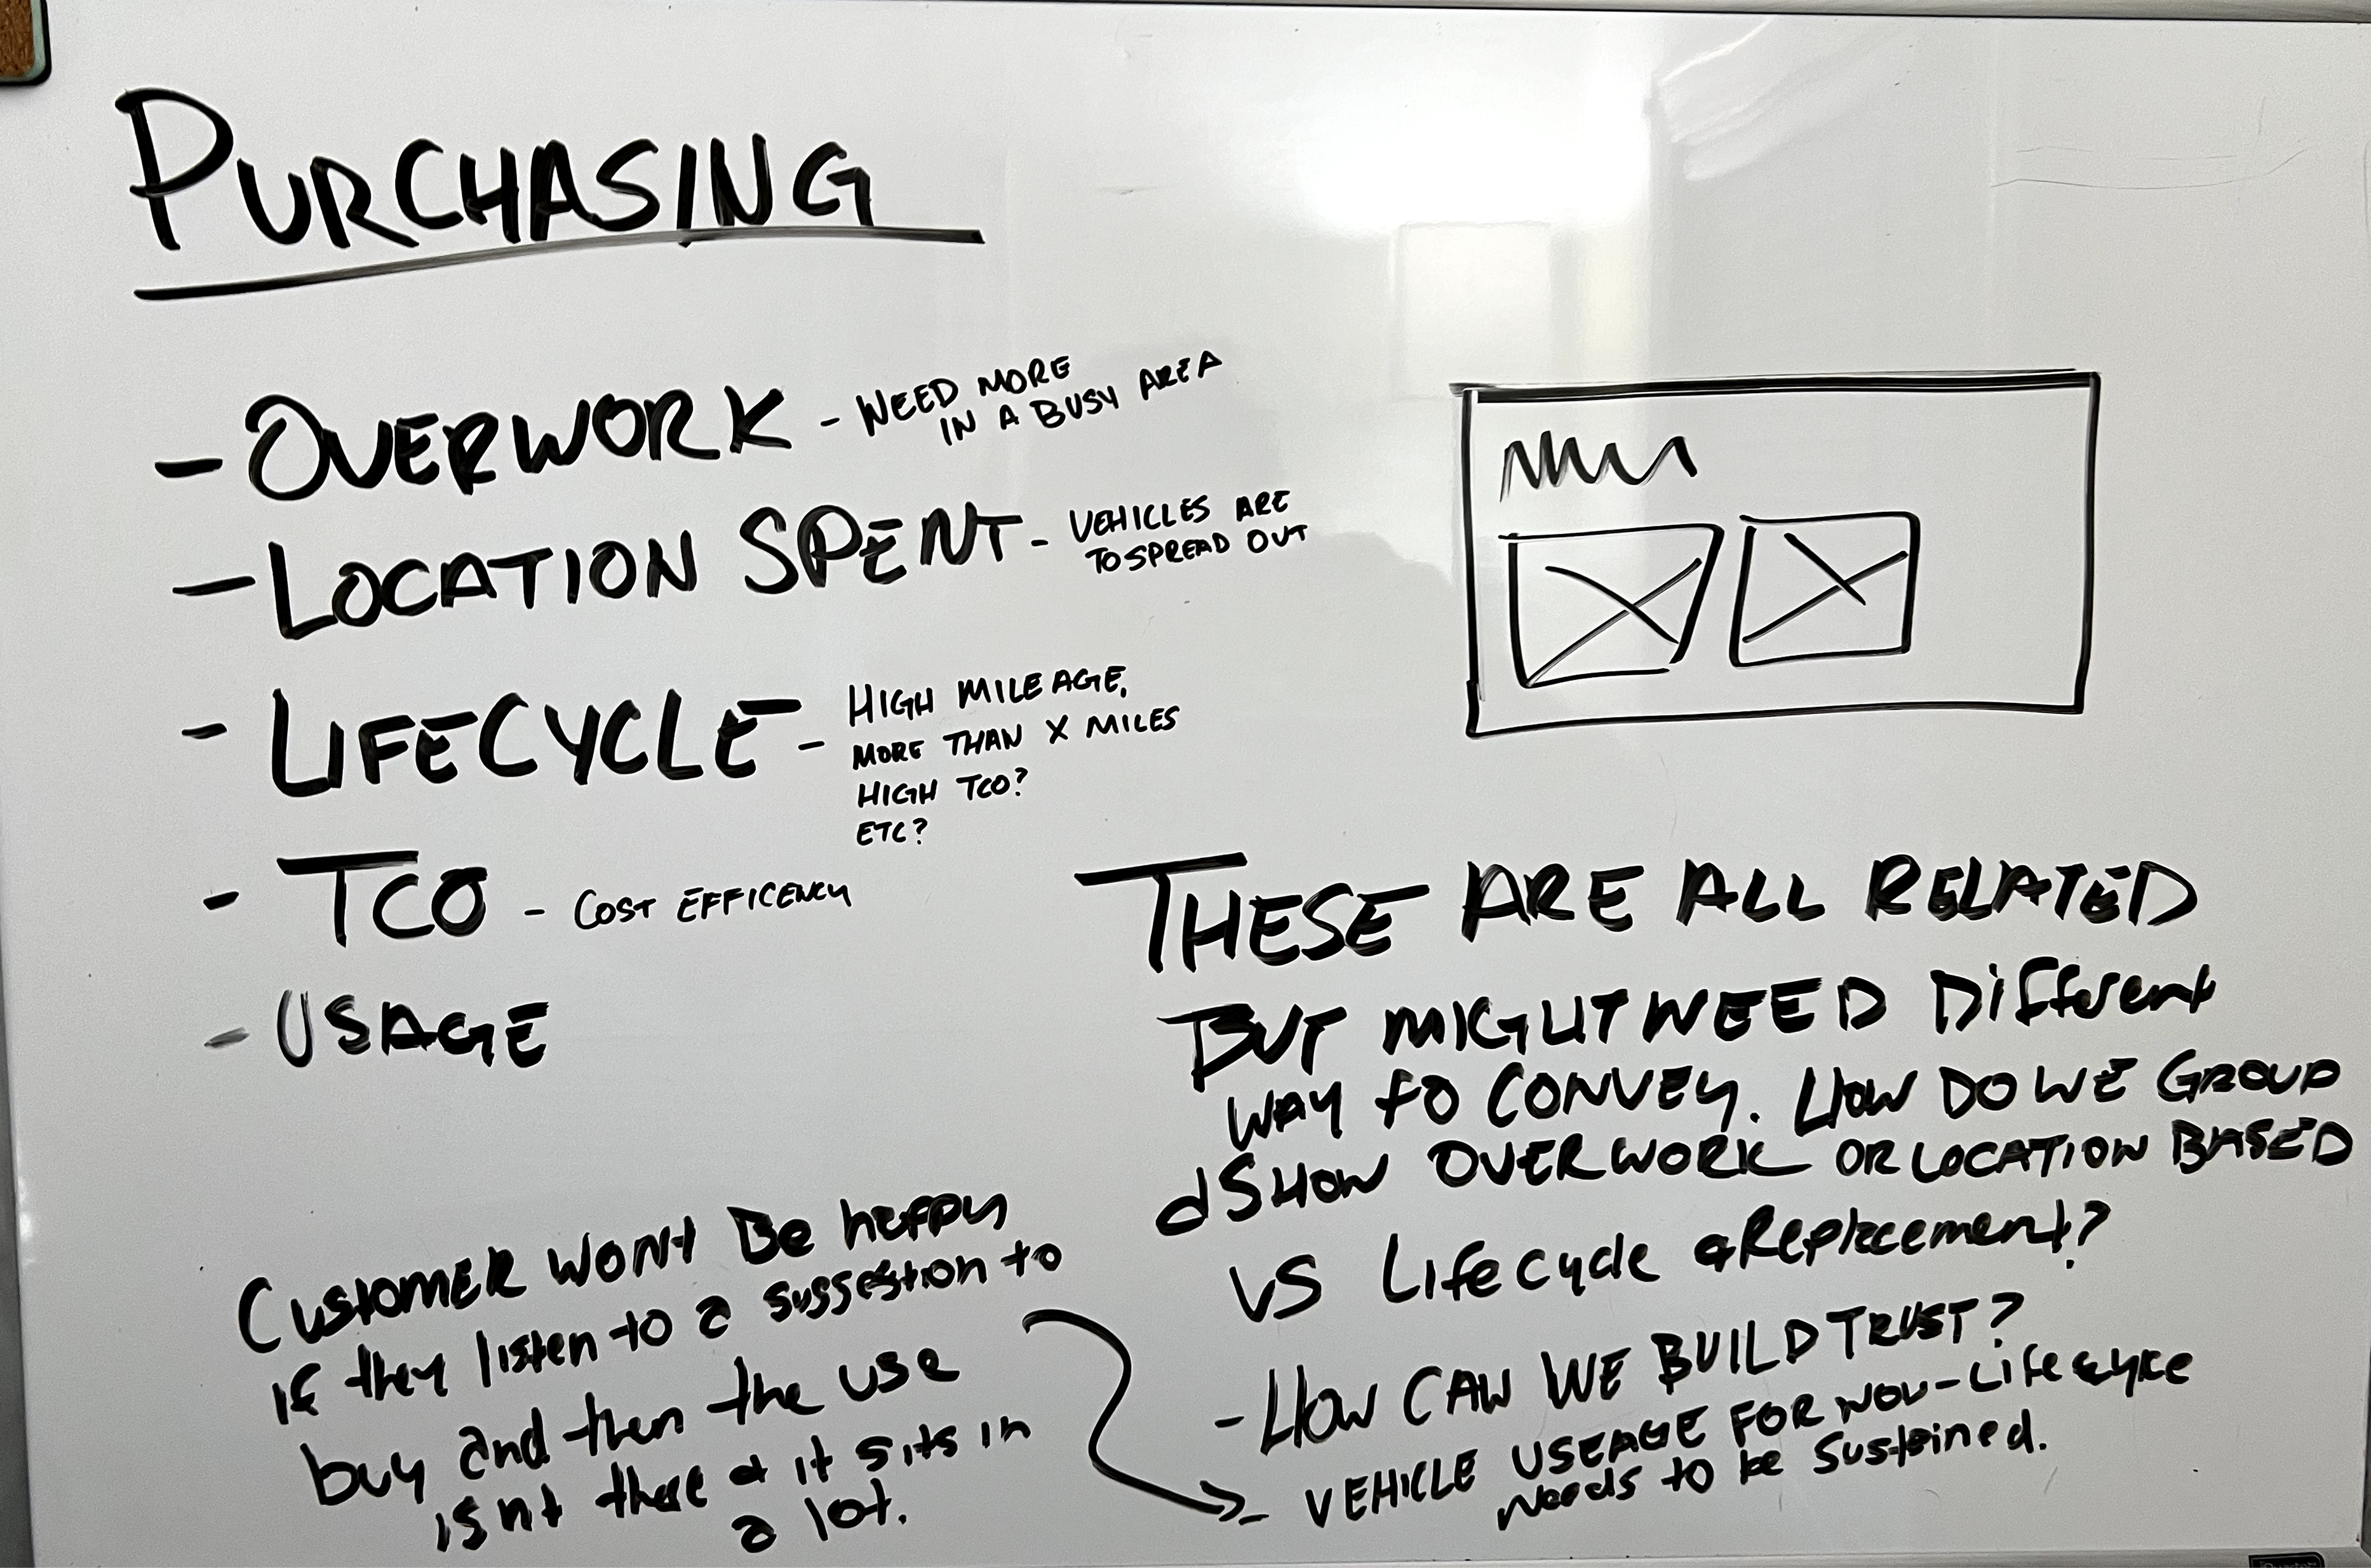
The idea of leading with goals wasn't entirely new — even in the earliest notes, there's a flag questioning whether the concept was "too heavy on goals." But that idea kept losing to the pull toward showing more data, which is what most of the exploration defaulted back to. My manager's parallel direction leaned further into dashboards and graphs; my own exploration — trust-building visualizations, anomaly detection, scale modeling, third-party integrations — kept arriving at more of the same. Neither of us fully broke the pattern, and the project stalled when priorities shifted elsewhere.
Looking back, I don't think it was a visualization problem. It was the wrong starting point. Fleet directors already have more data than they can realistically consume — their challenge isn't finding information, it's deciding what deserves attention.
A weekend to rework a year and a half of assumptions.
A year and a half later, the director who'd originally sponsored that work asked to revisit it as the team's platform neared launch. The invite came on a Friday for a Monday meeting — I had the weekend.
Going back through my old notes, one observation kept resurfacing: fleet directors don't wake up asking "How is maintenance performing?" or "Show me my safety dashboard." They ask questions like — are we going to hit our cost targets? Should we replace vehicles this year or next? Which decisions will have the biggest financial impact?
That realization completely changed how I approached the concept: fleet directors don't struggle to find data — they struggle to know what to prioritize.
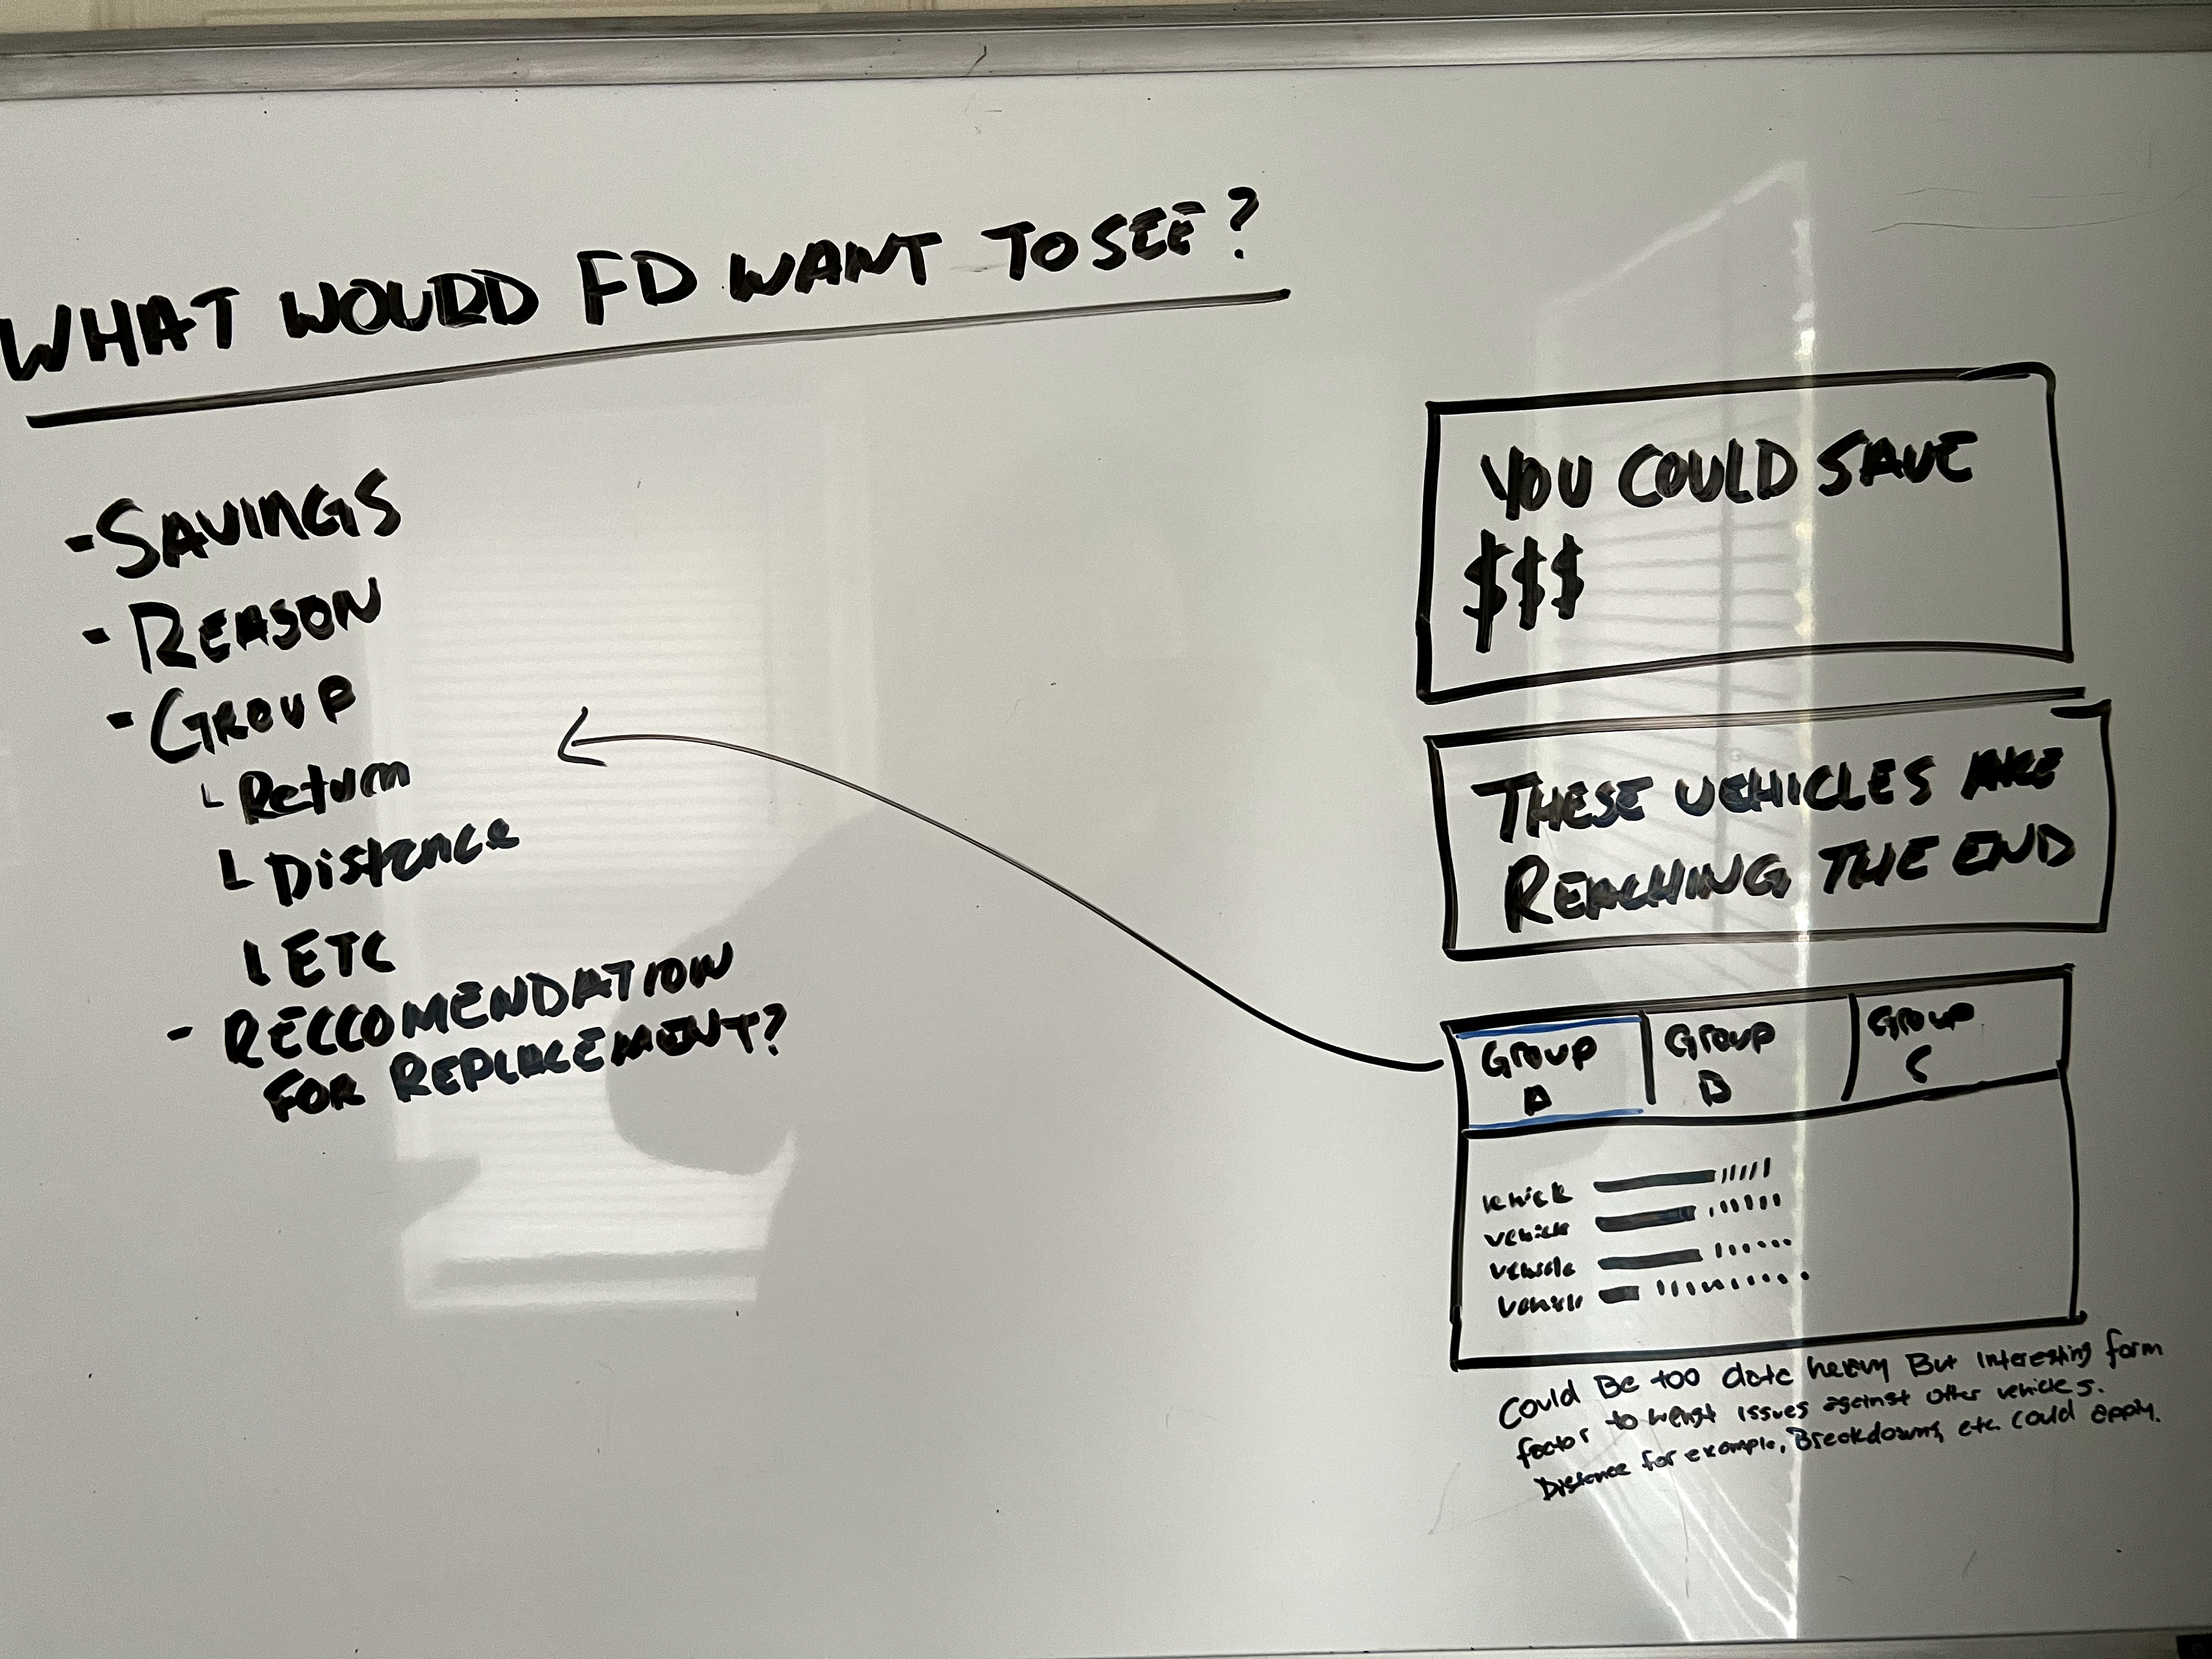
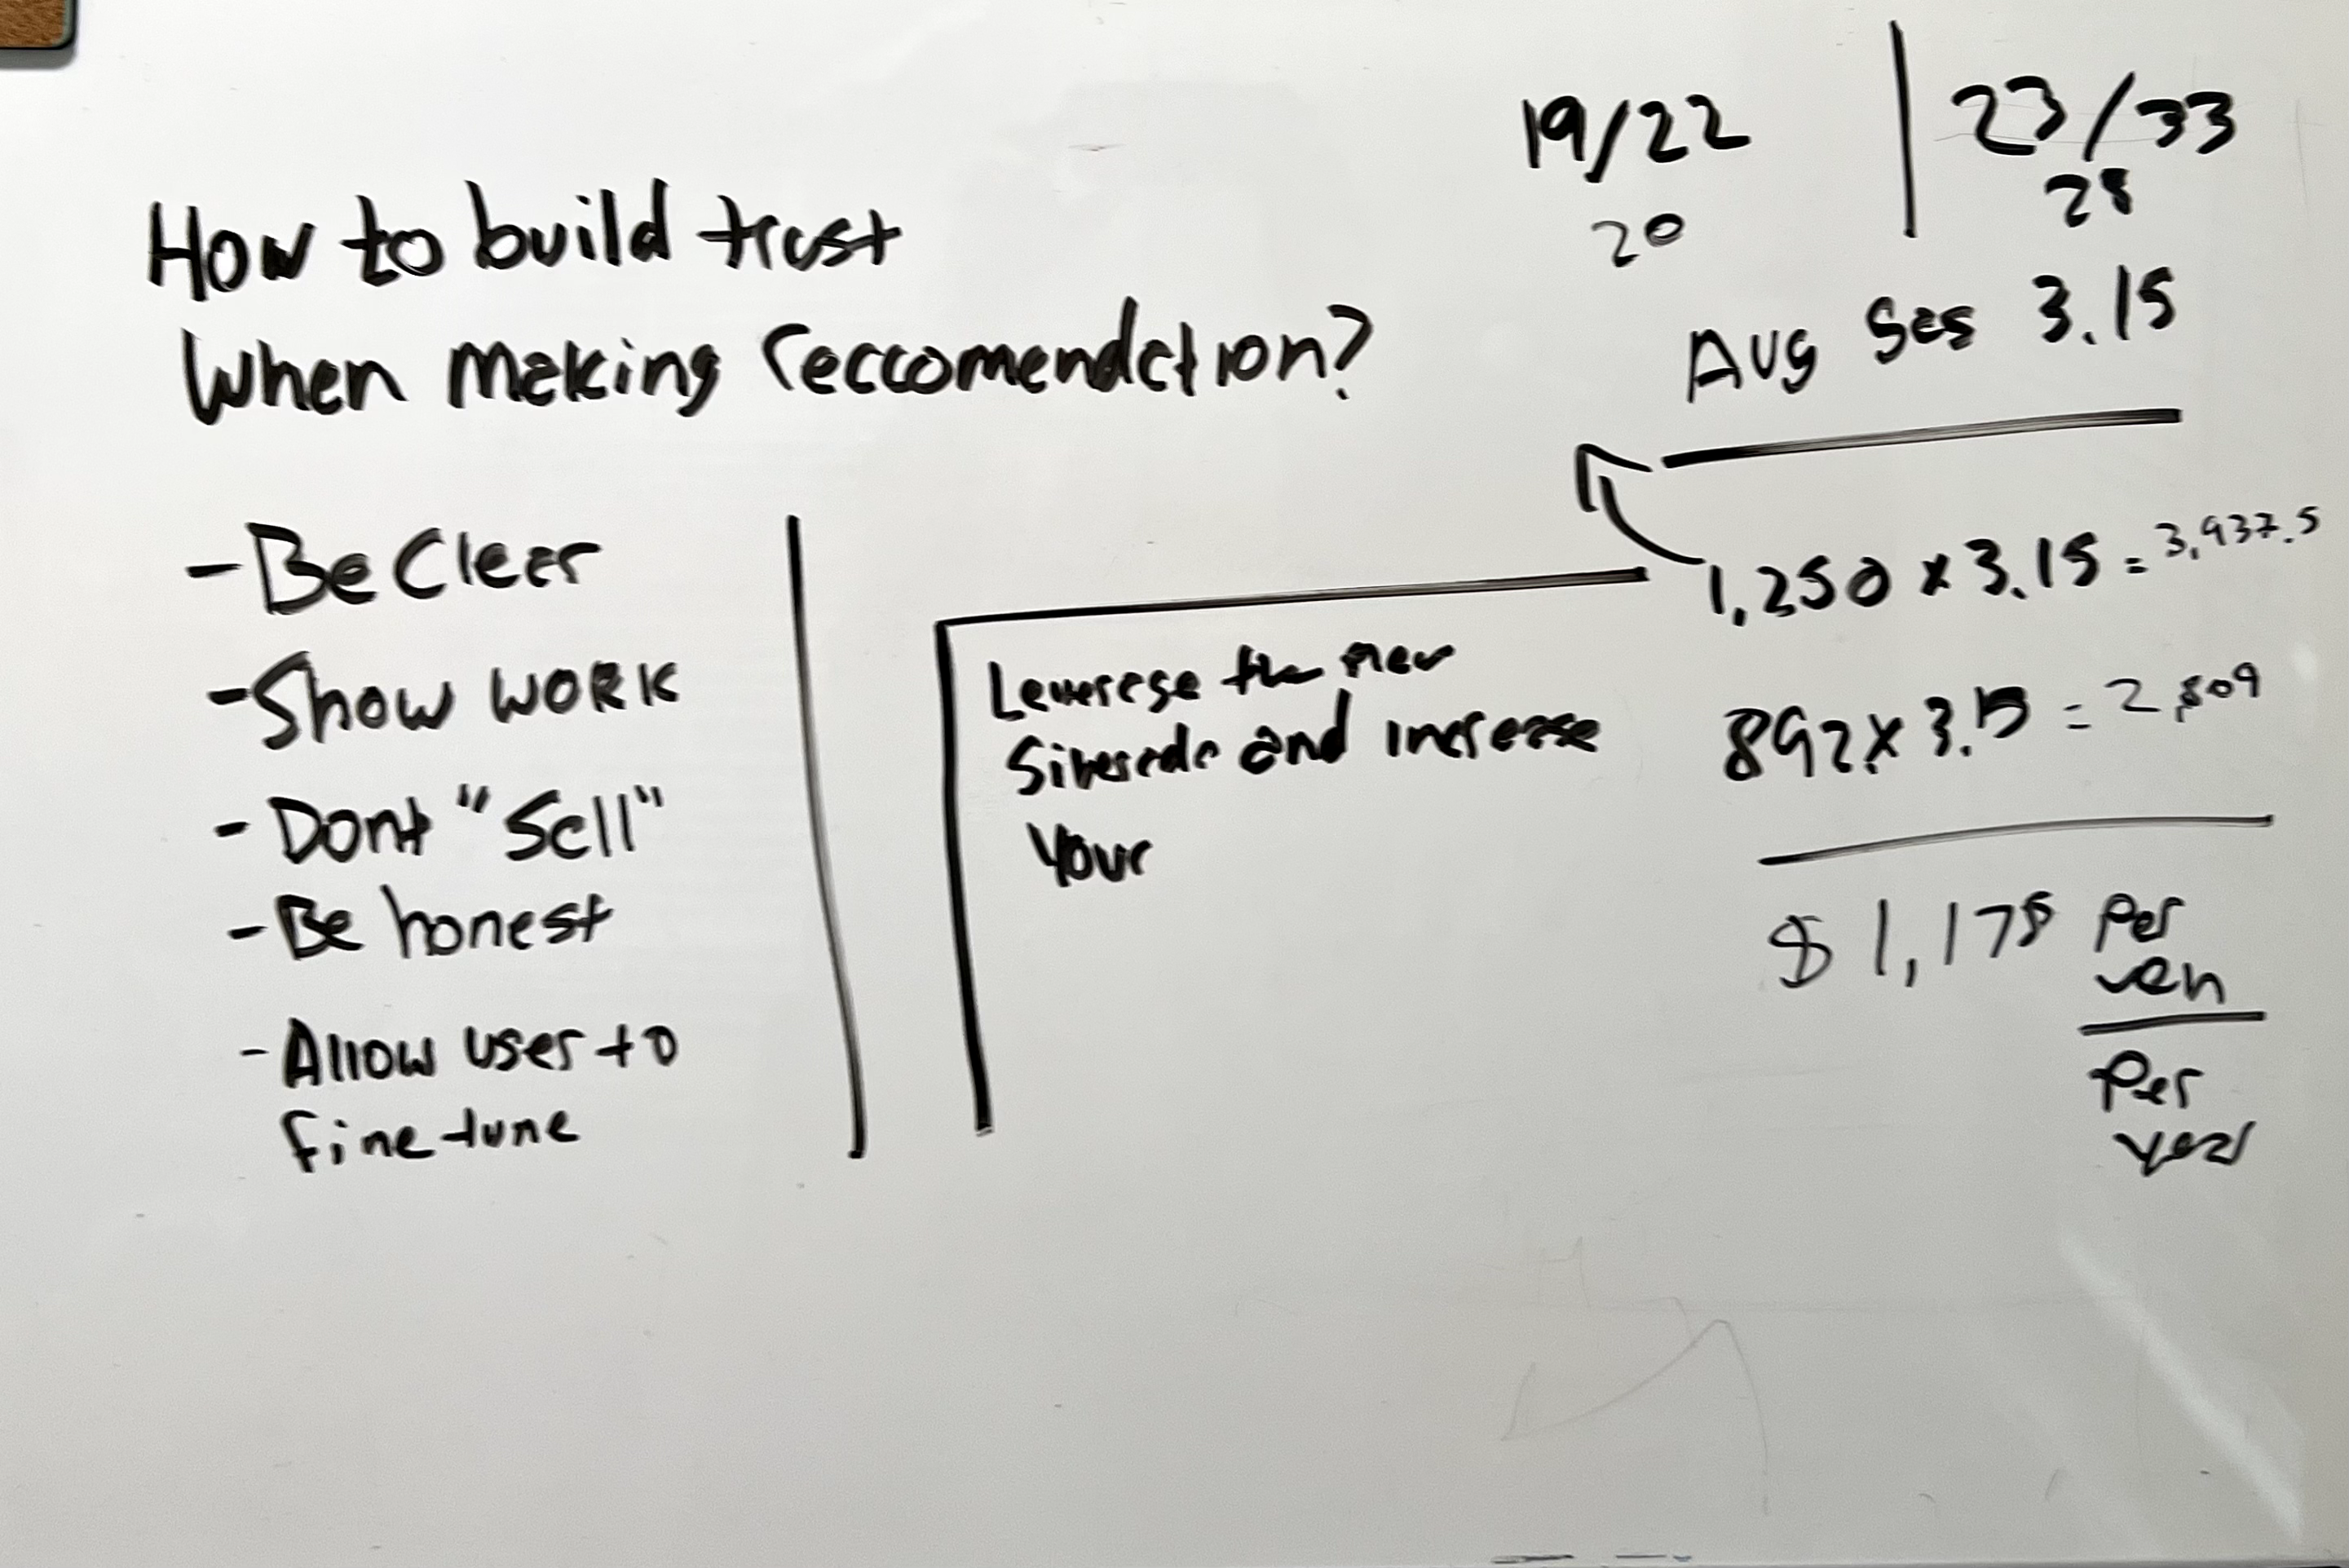
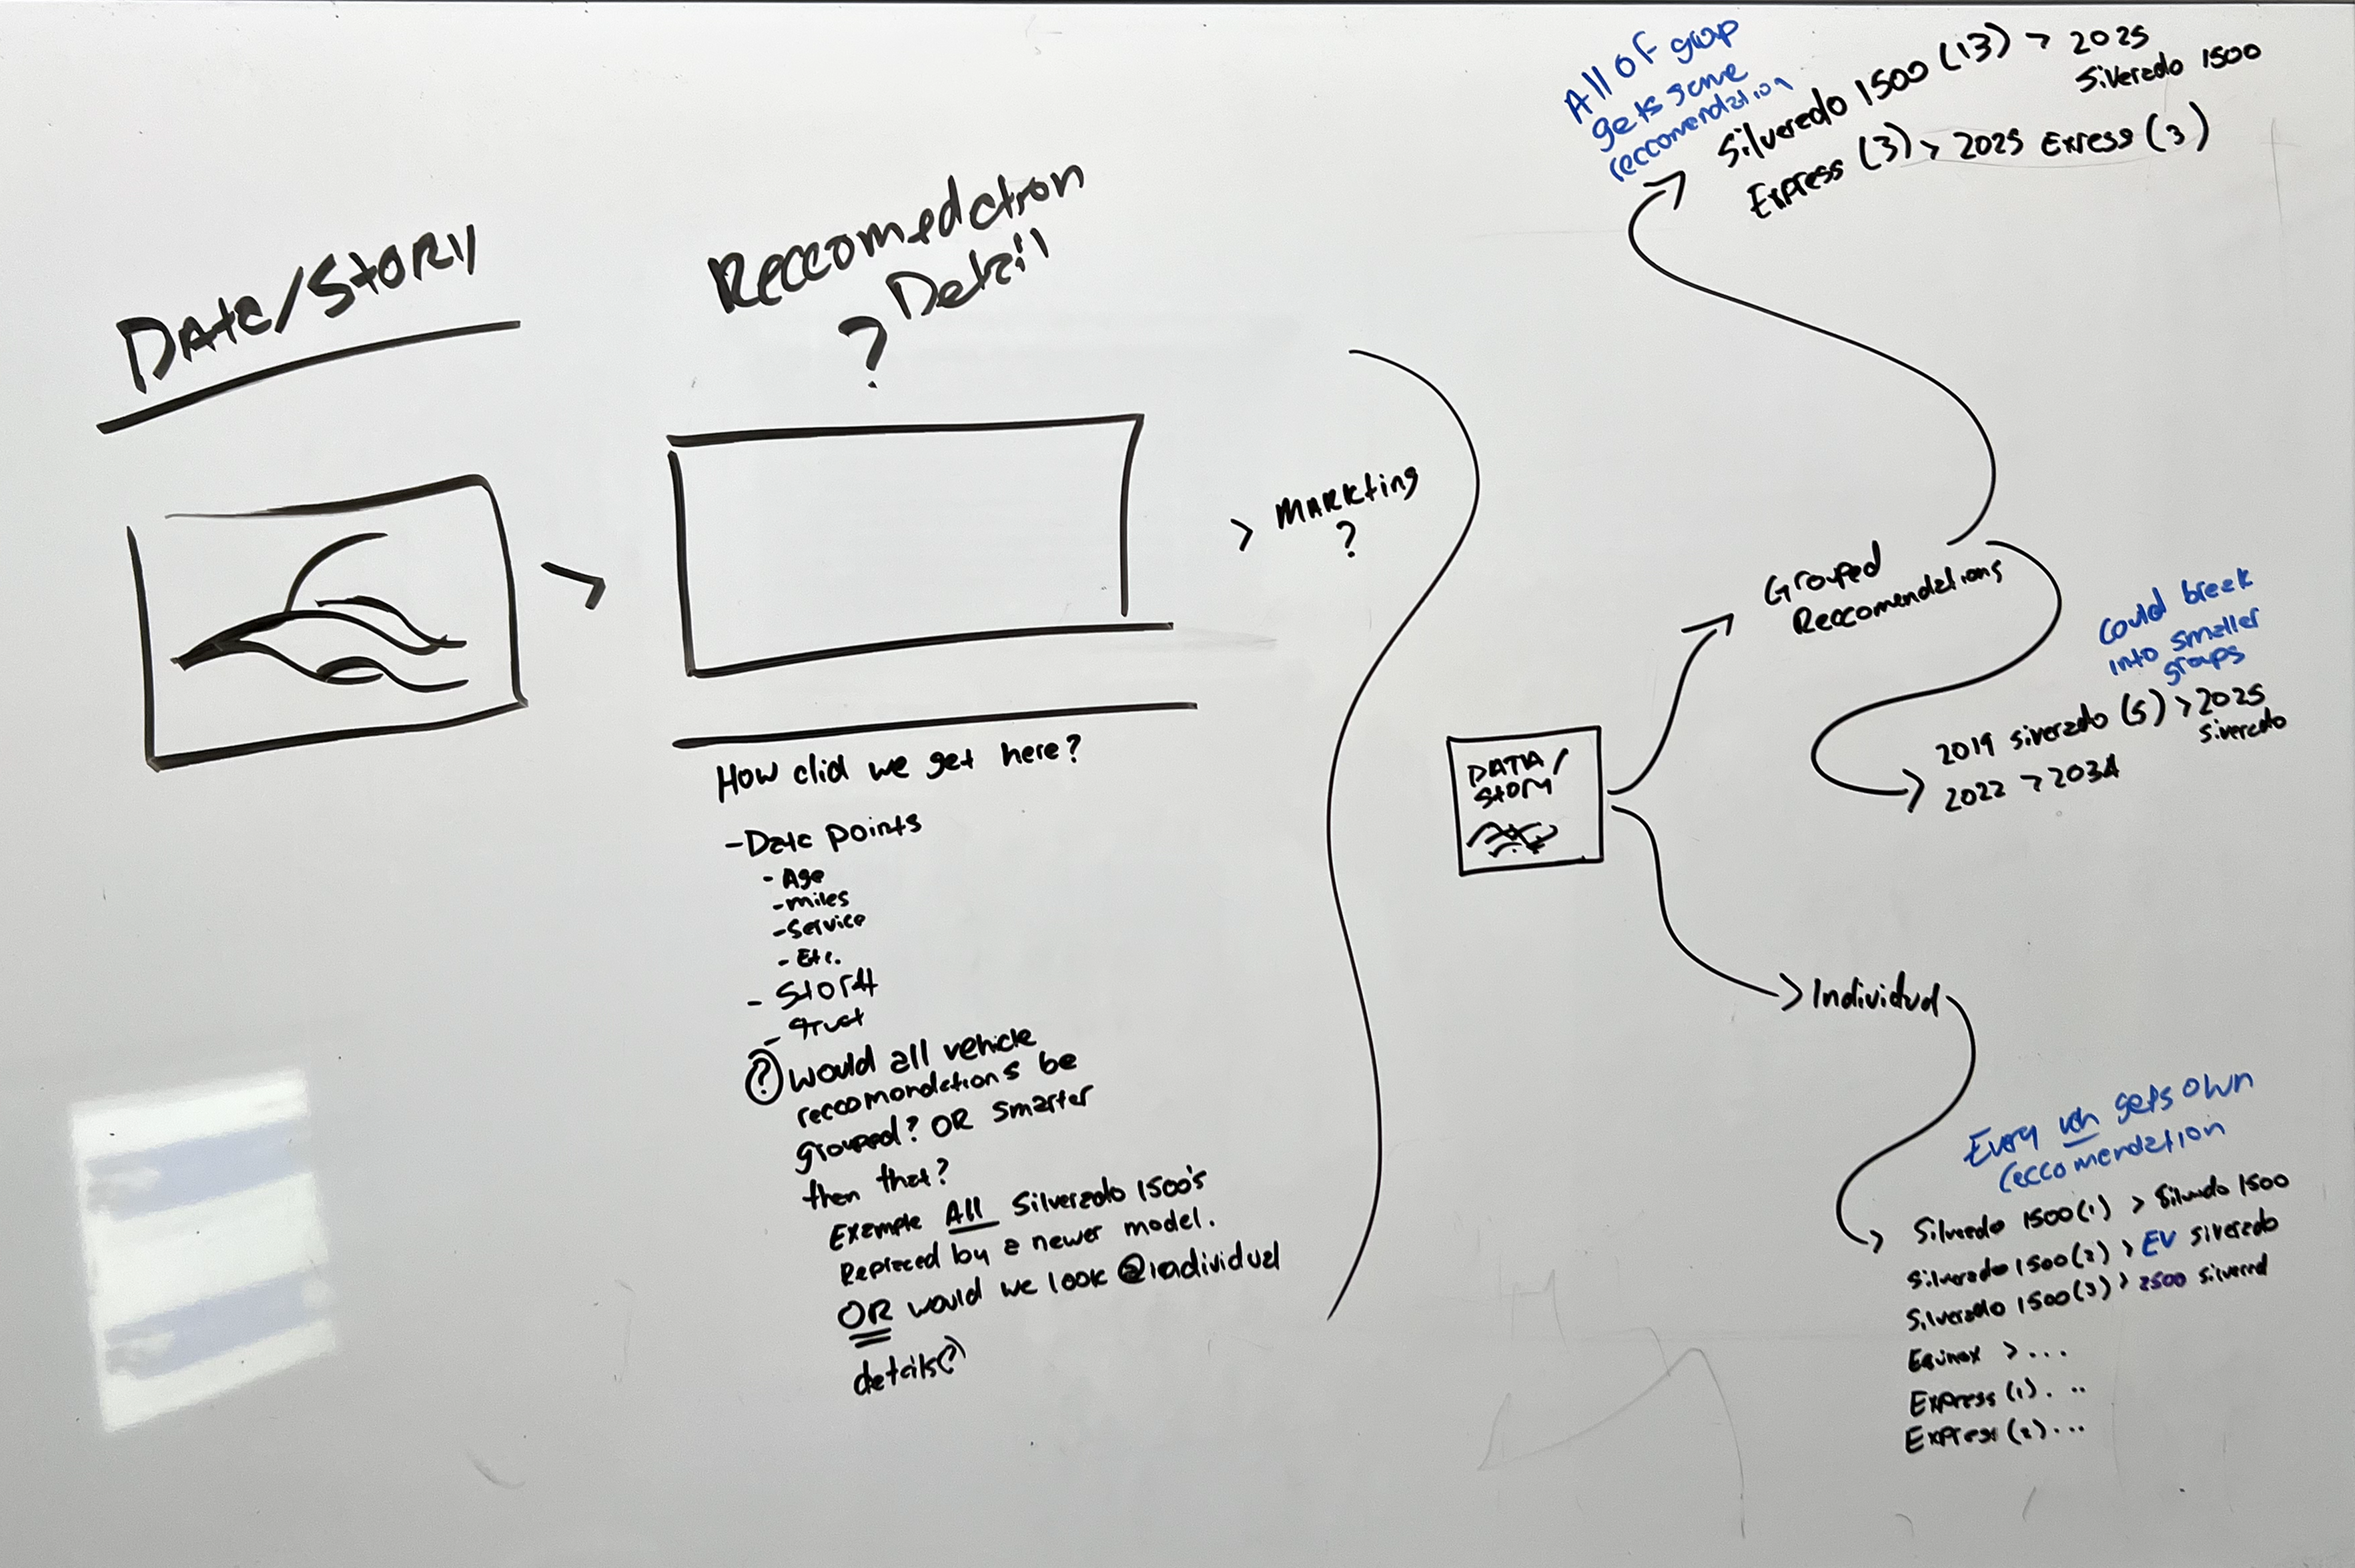
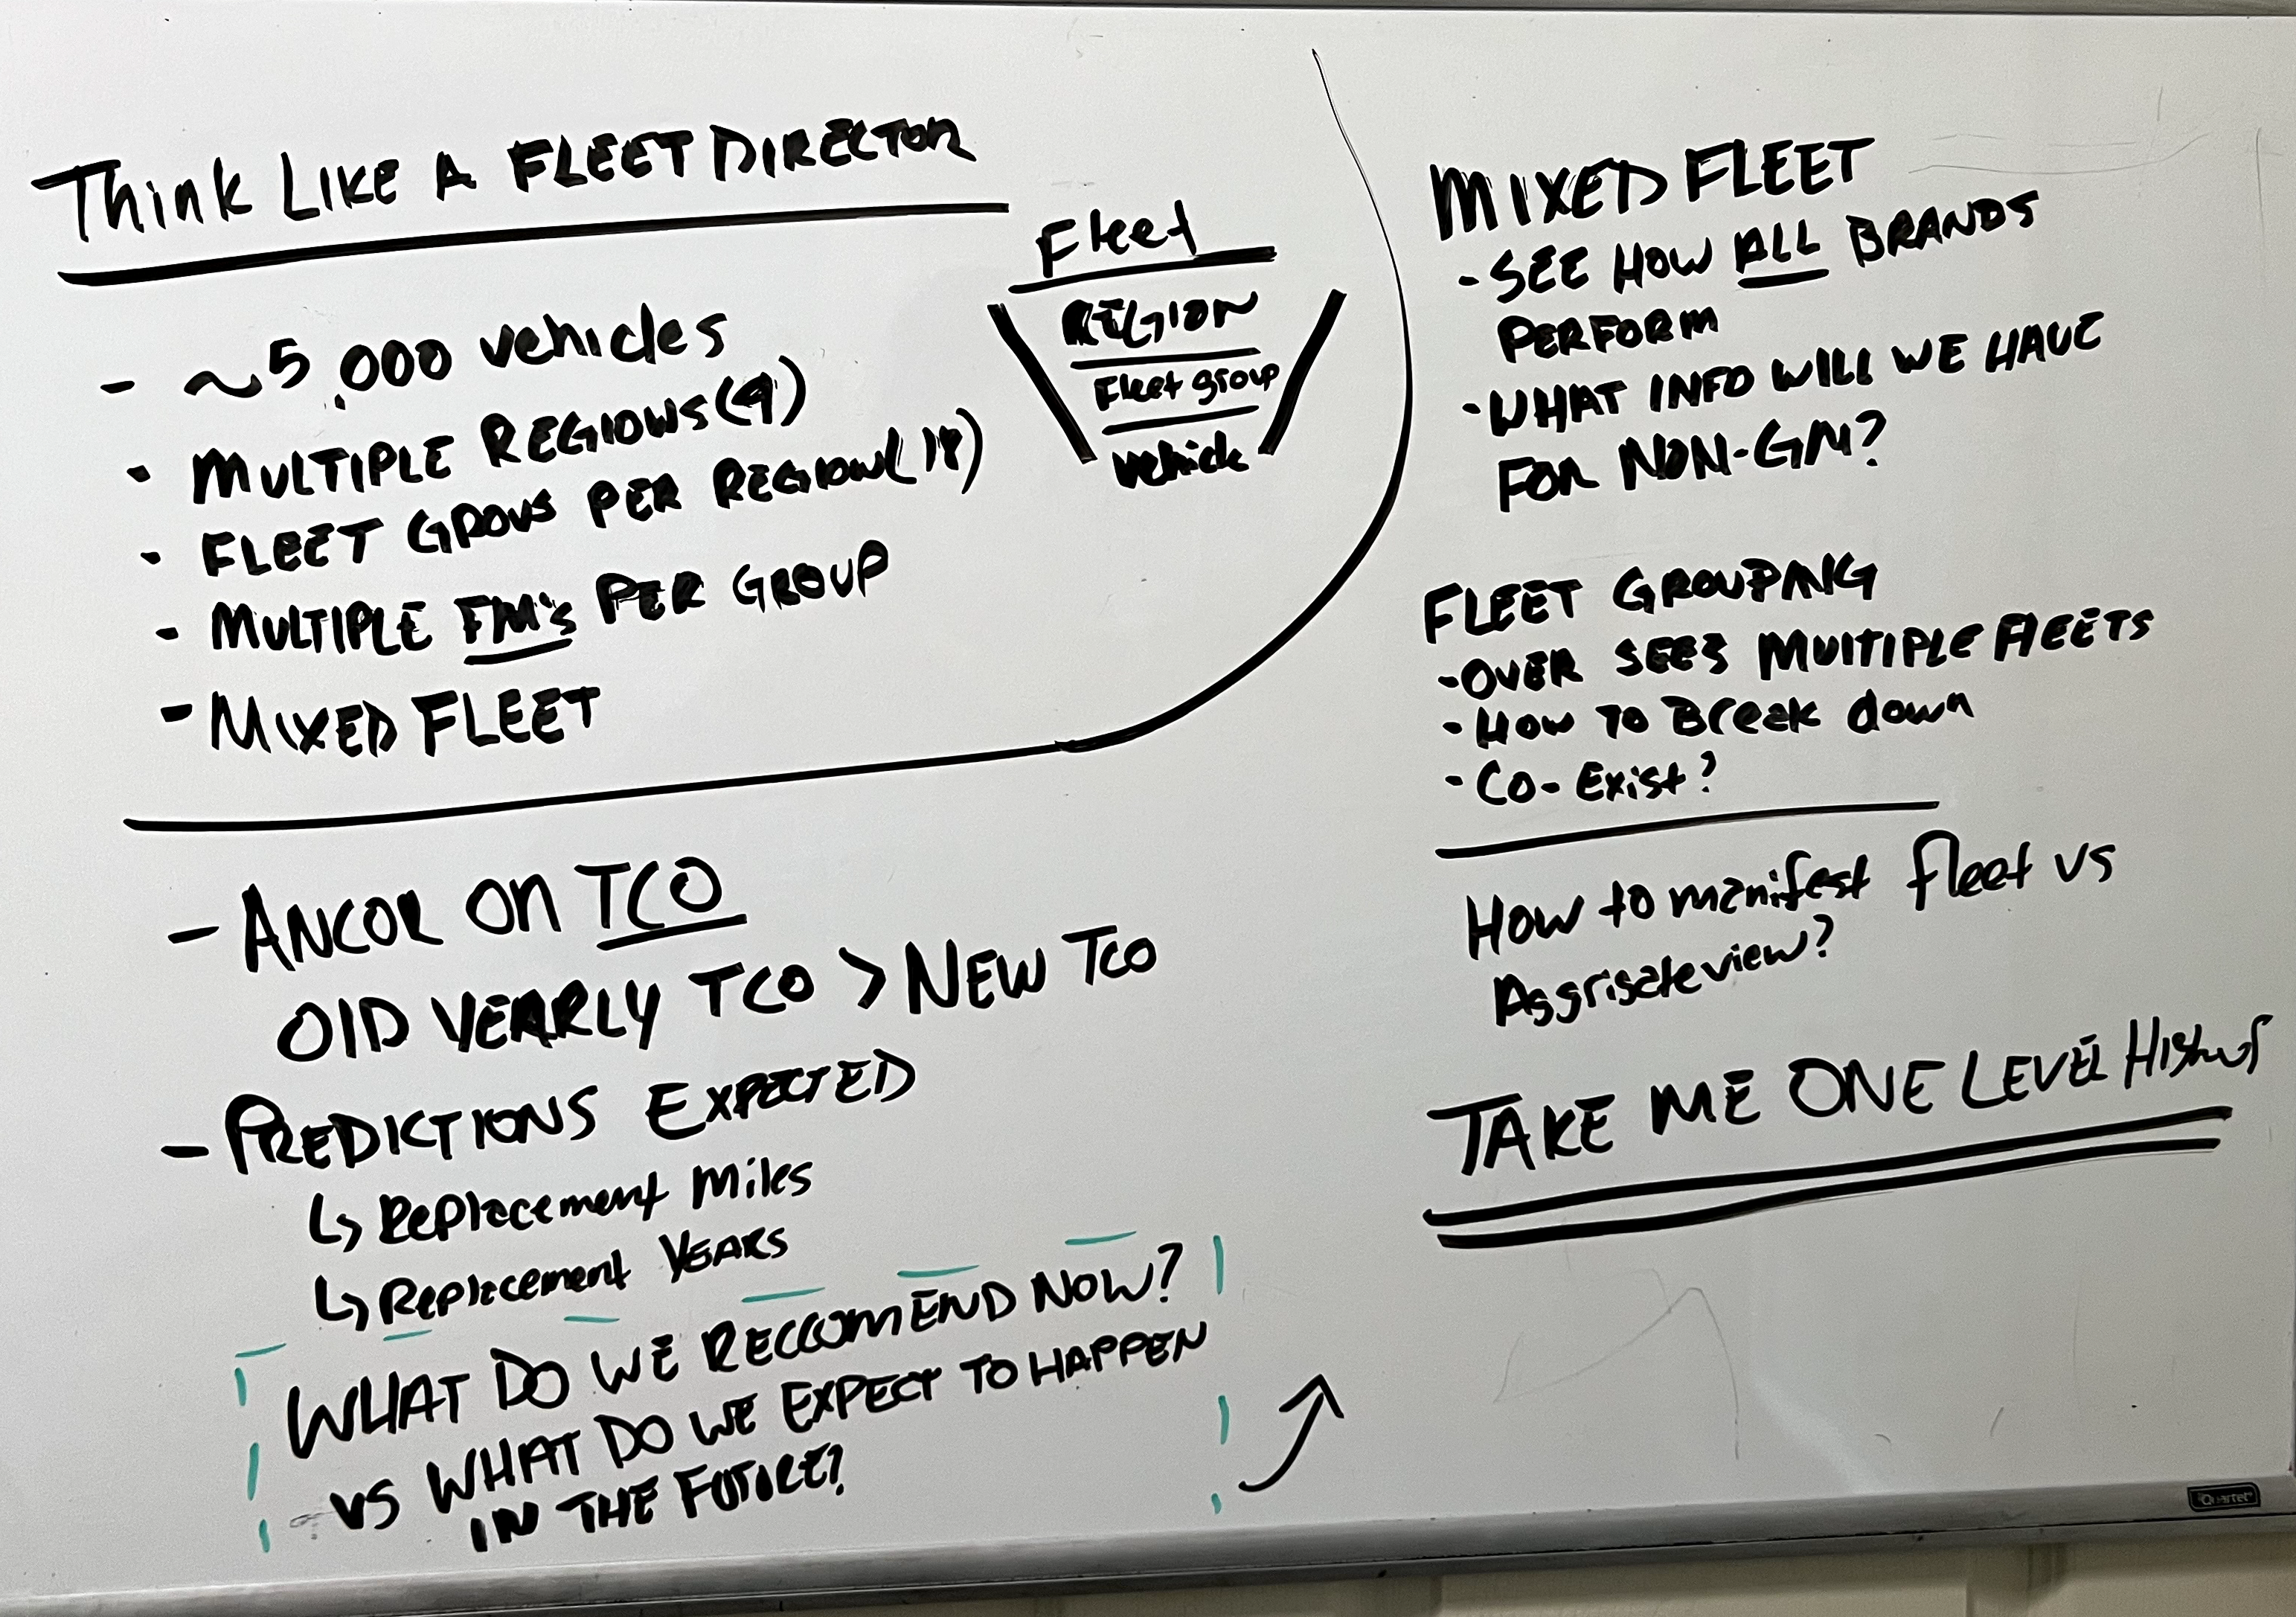
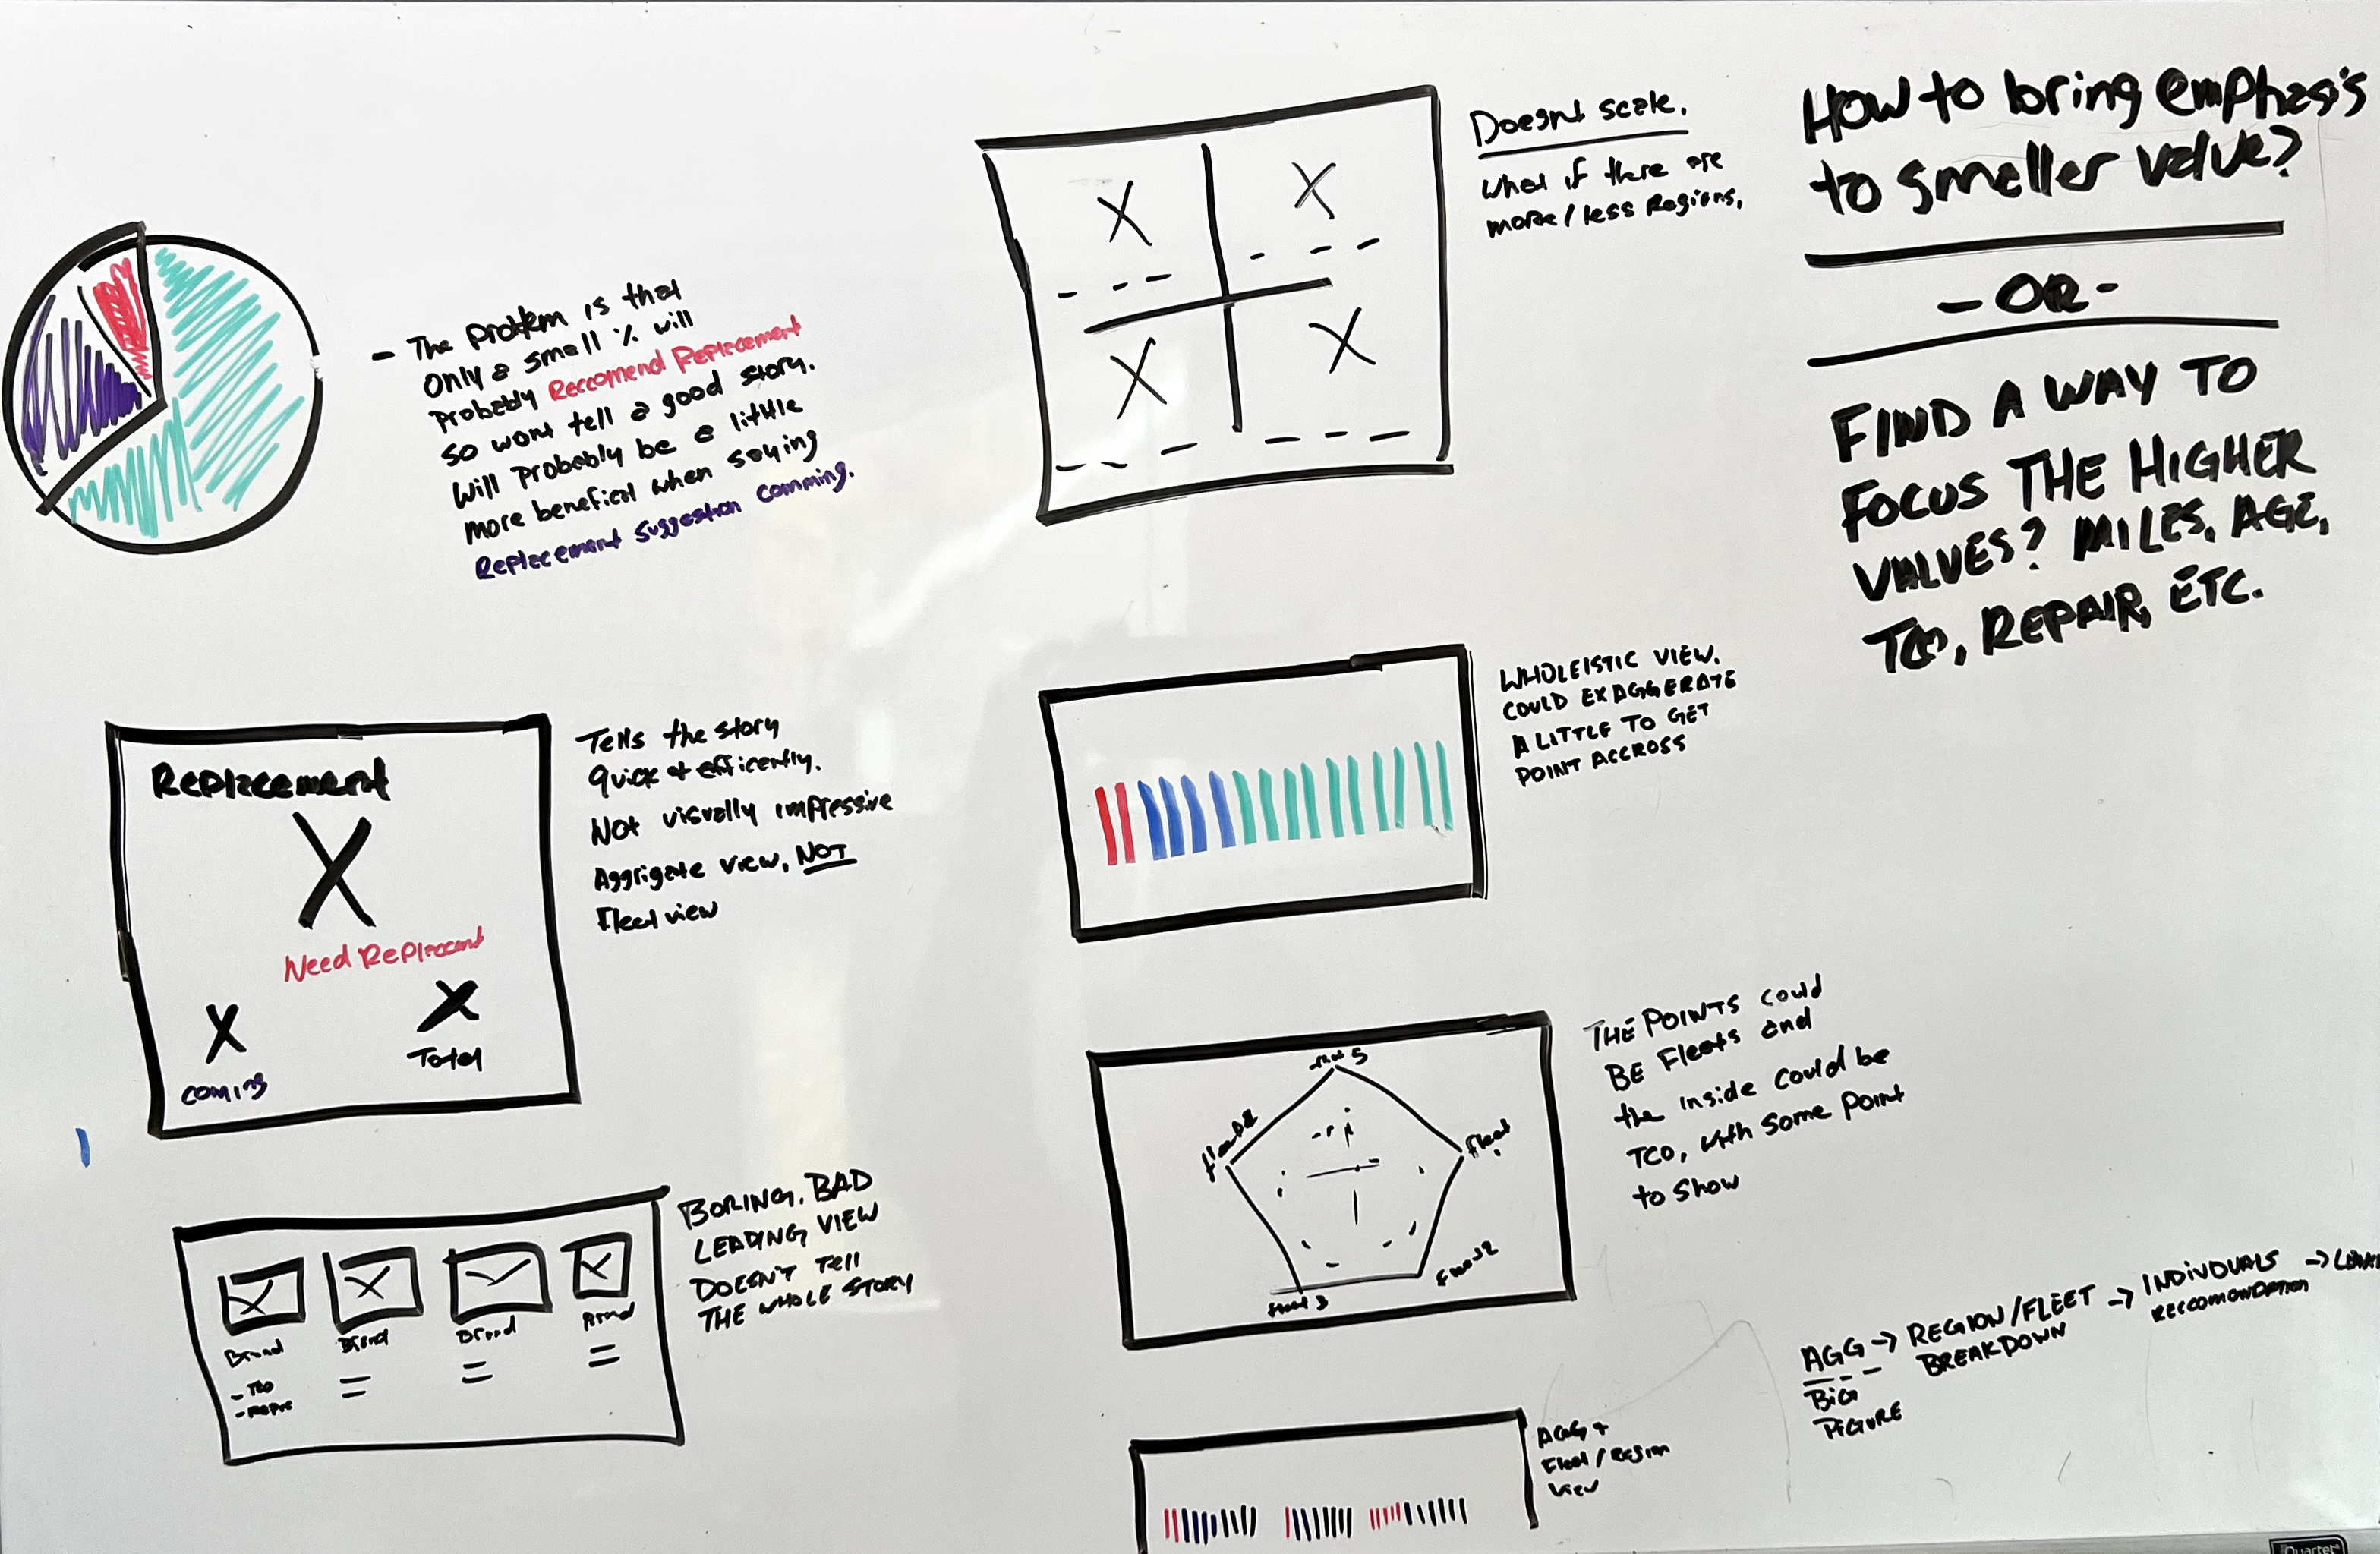
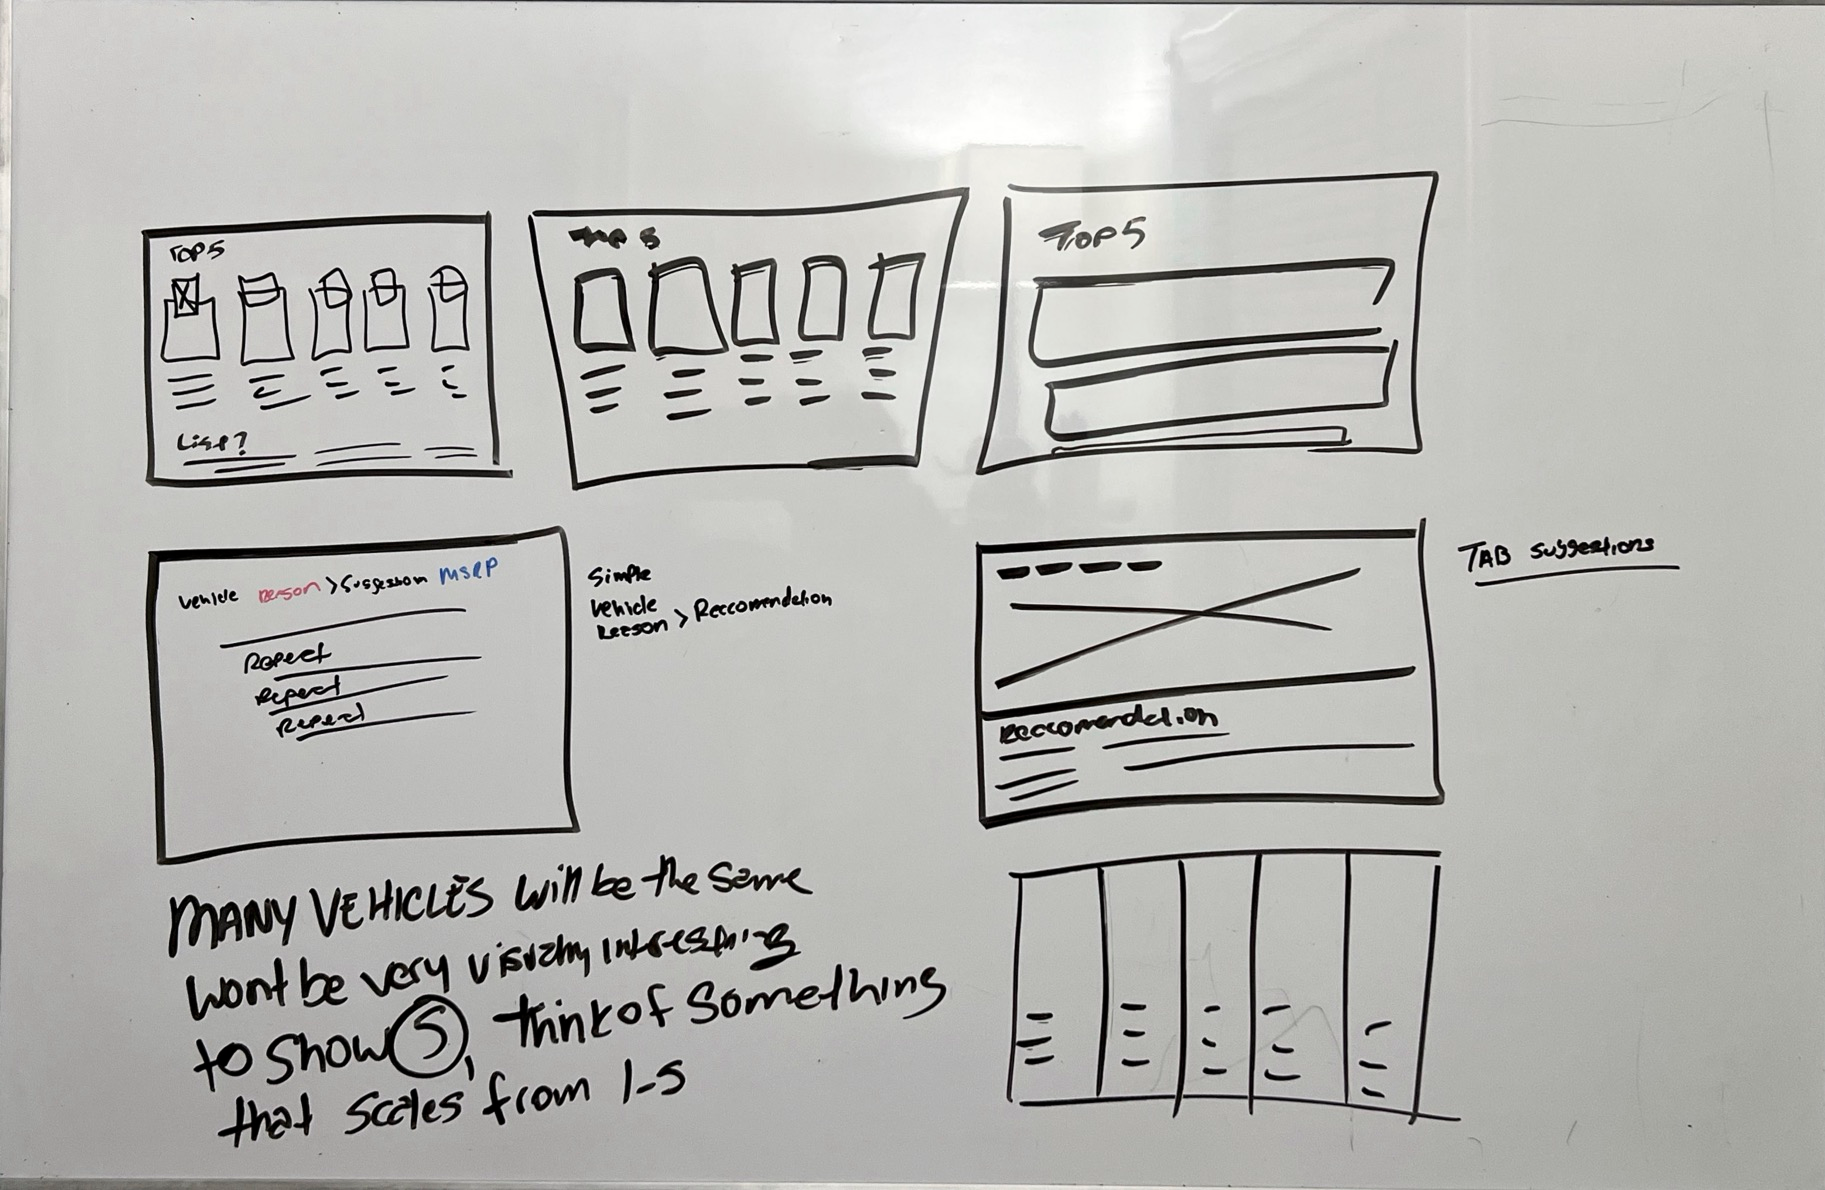
Organized around decisions, not categories.
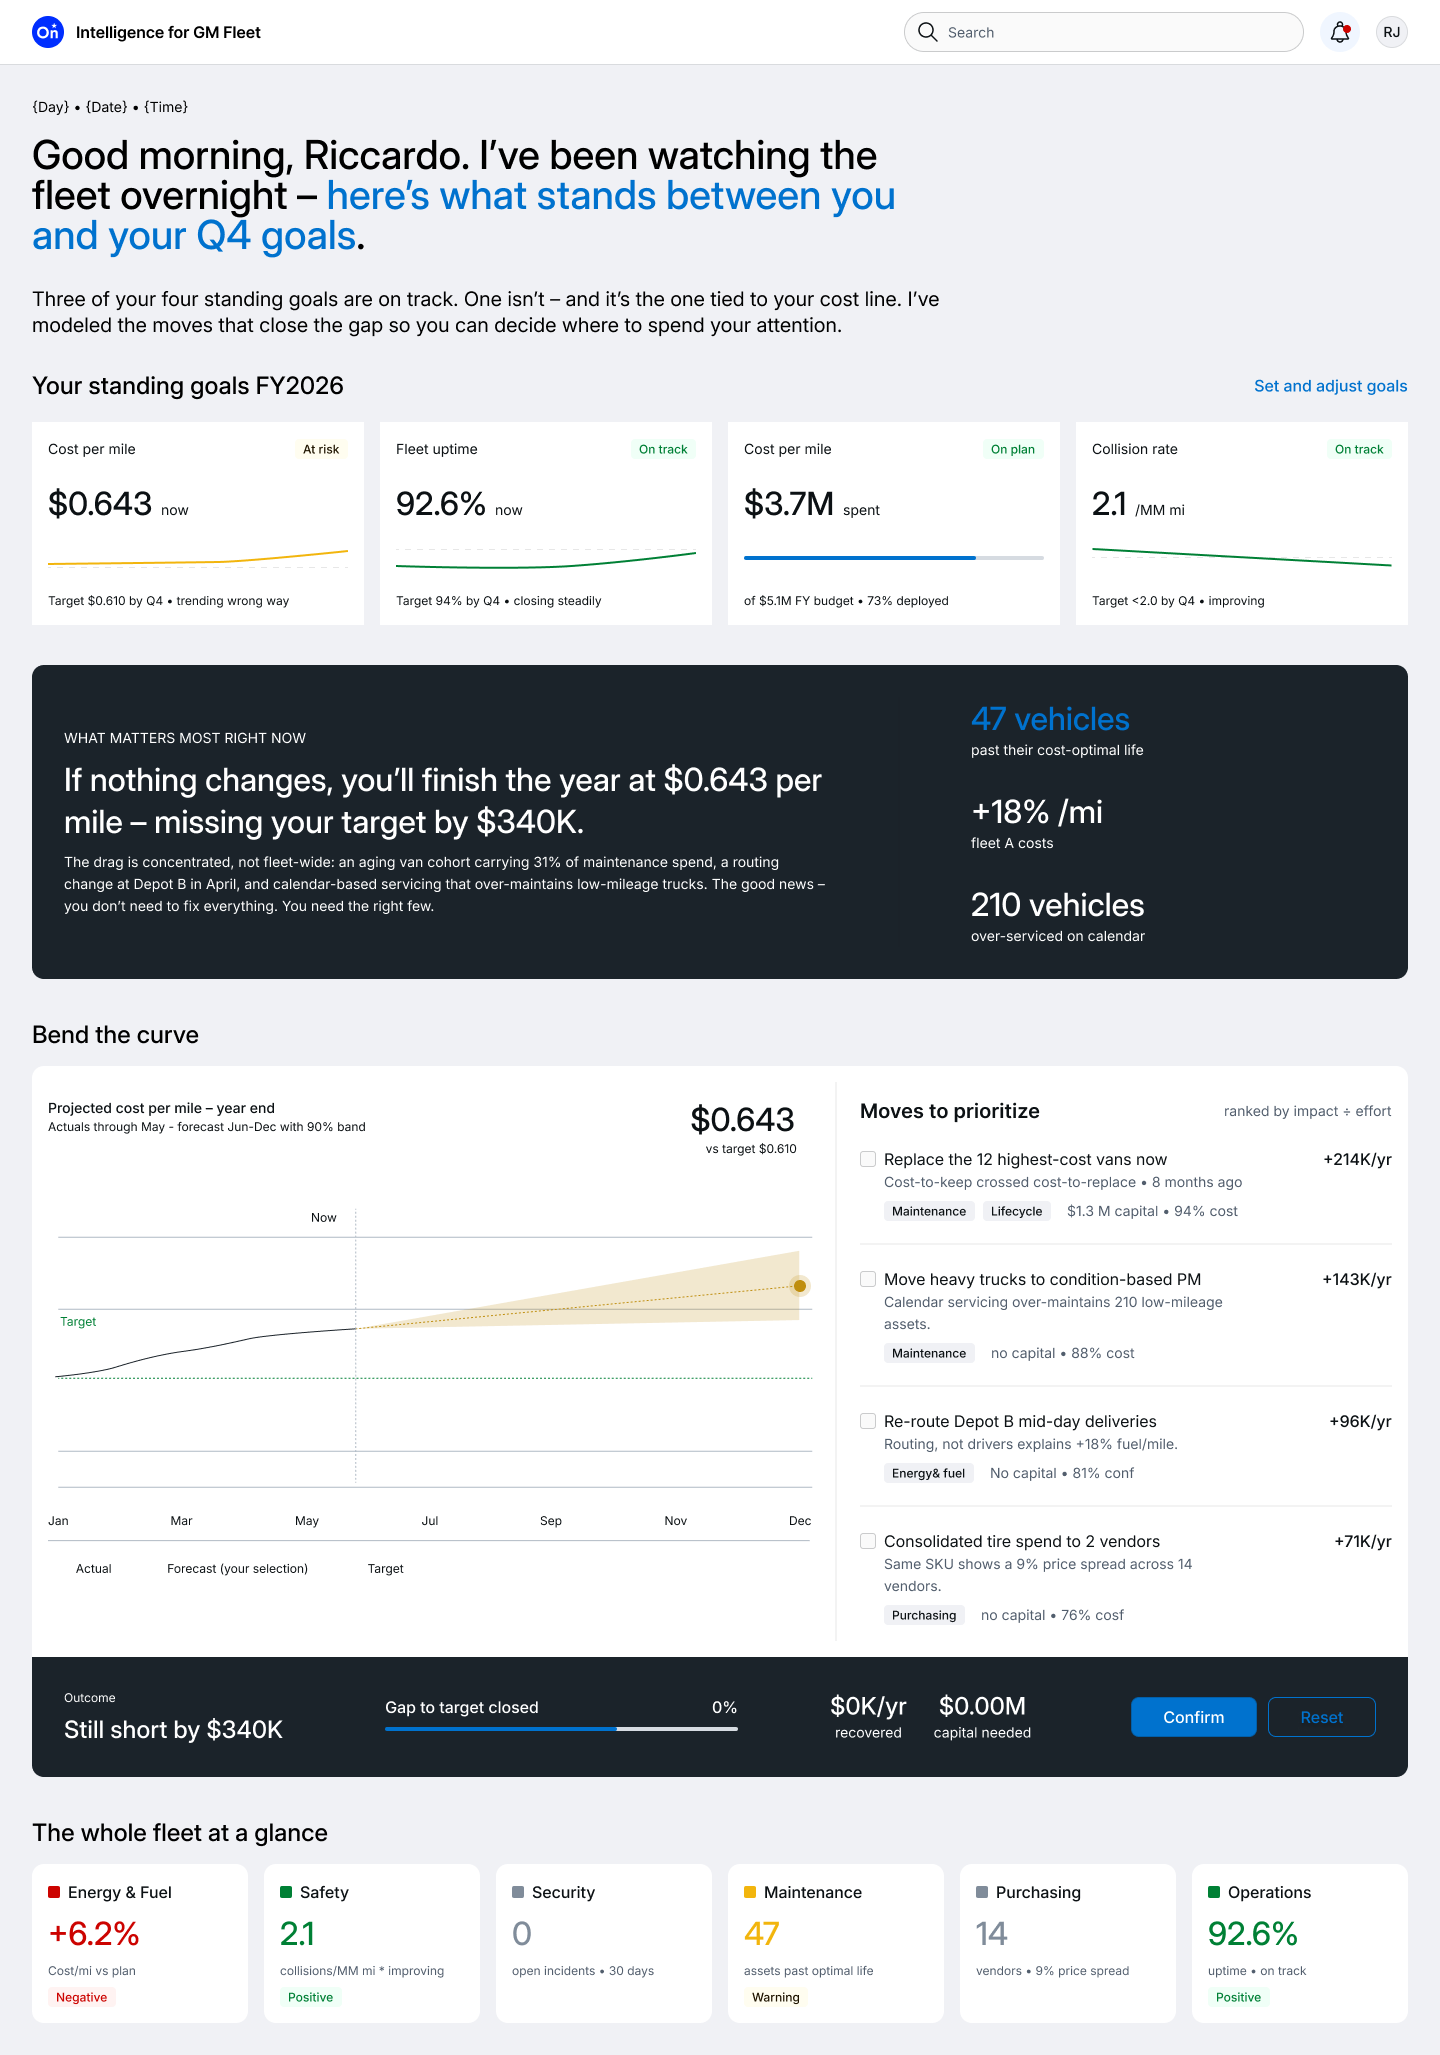
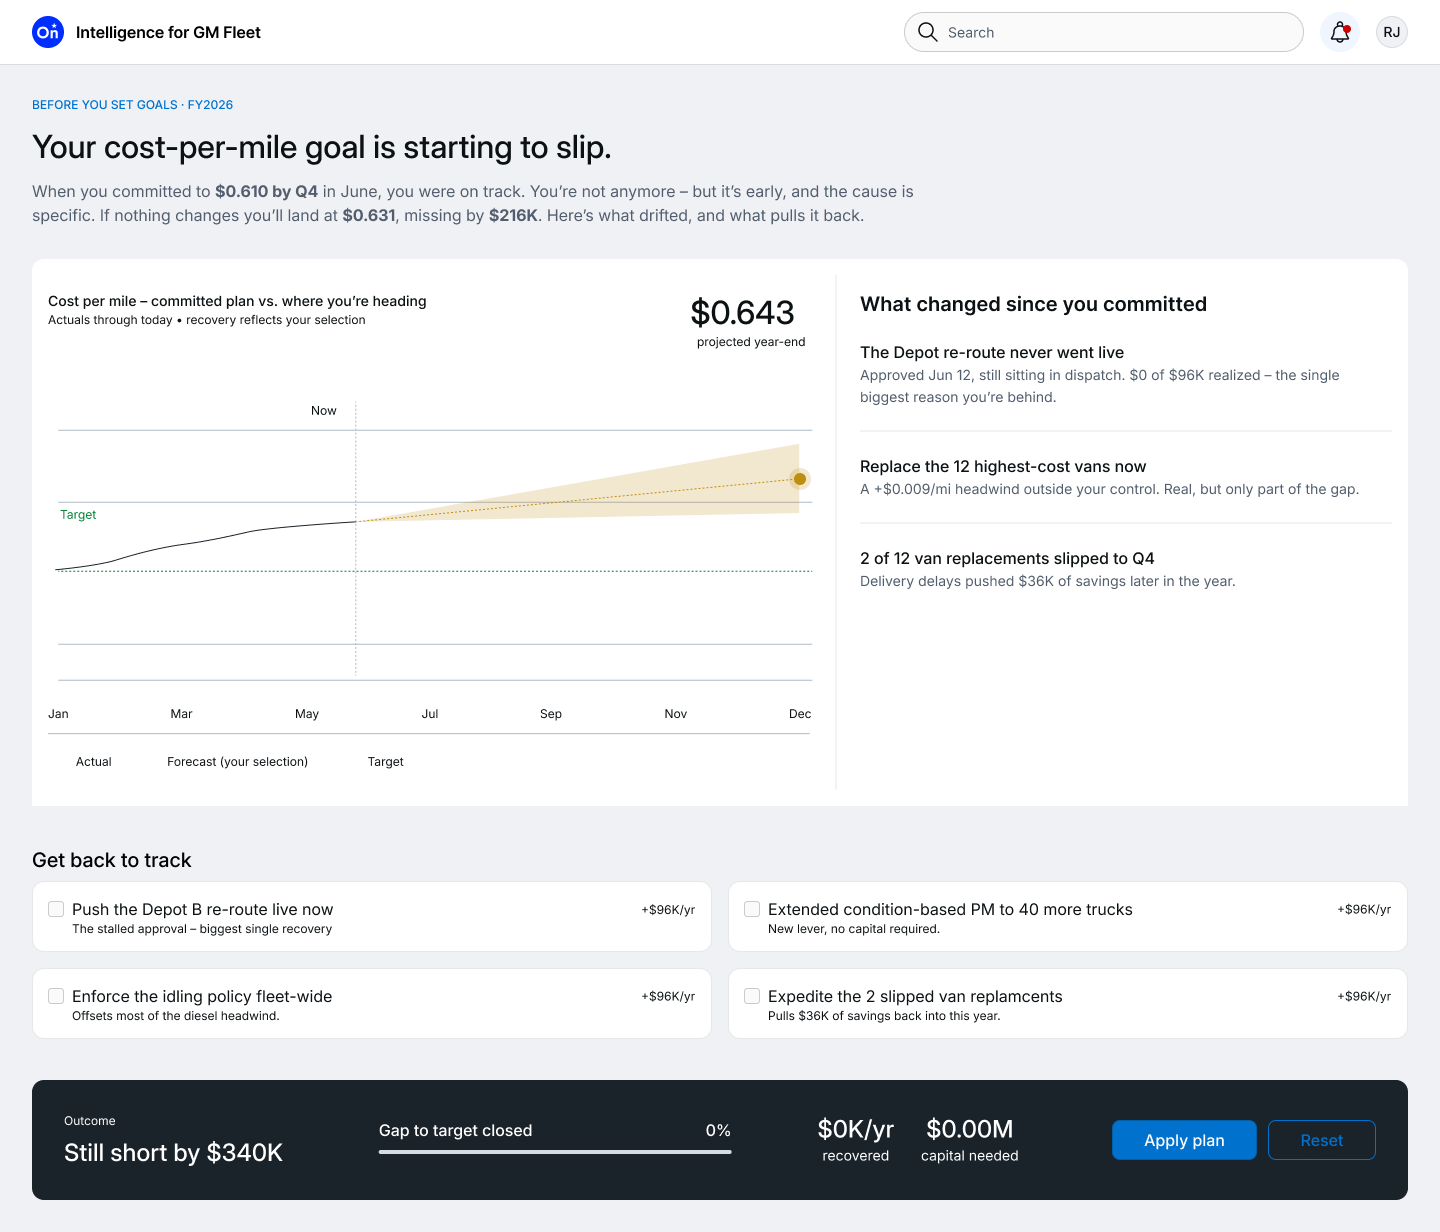
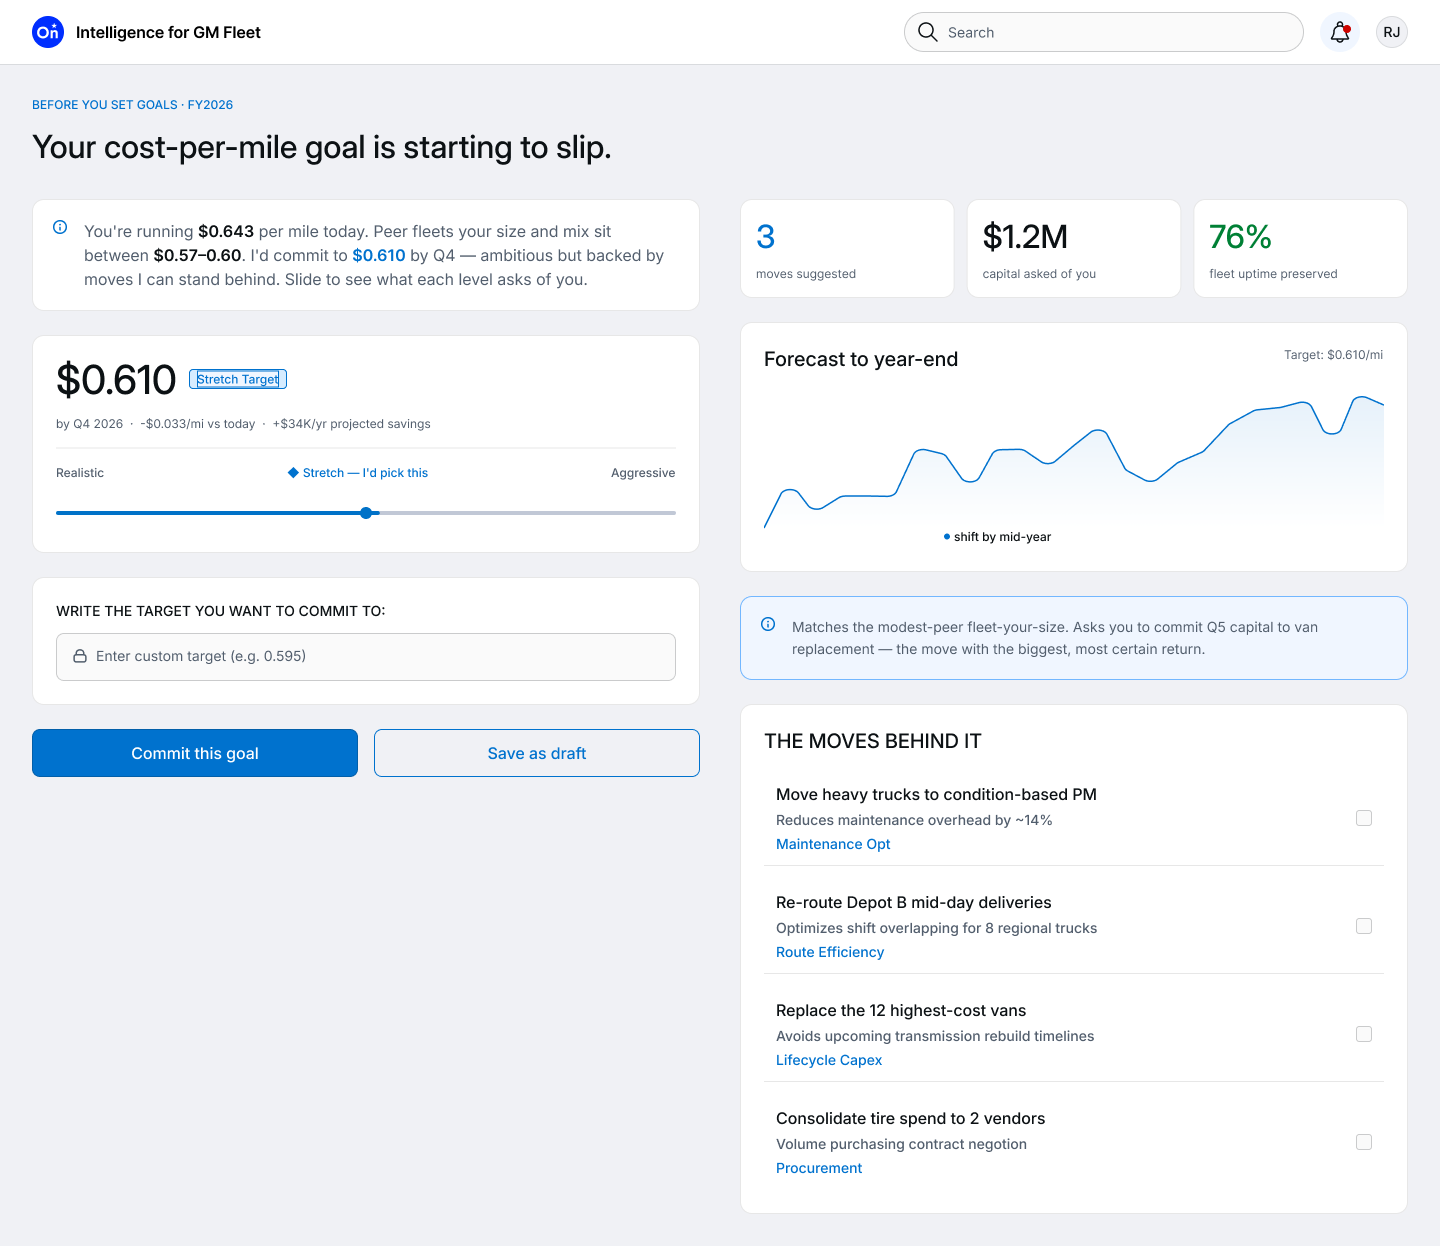
Instead of organizing the experience around categories like maintenance, safety, energy, and utilization, I organized it around the goals a fleet director is actually trying to achieve.
The homepage answers one question first: are we on track? Progress is stated in plain language — where the fleet is projected to land if nothing changes, relative to the director's stated goal. From there, the experience becomes exploratory: adjust a decision, like replacing the fleet's highest-cost vehicles, and watch the effect ripple through budget forecasts, operating costs, and long-term planning in real time.
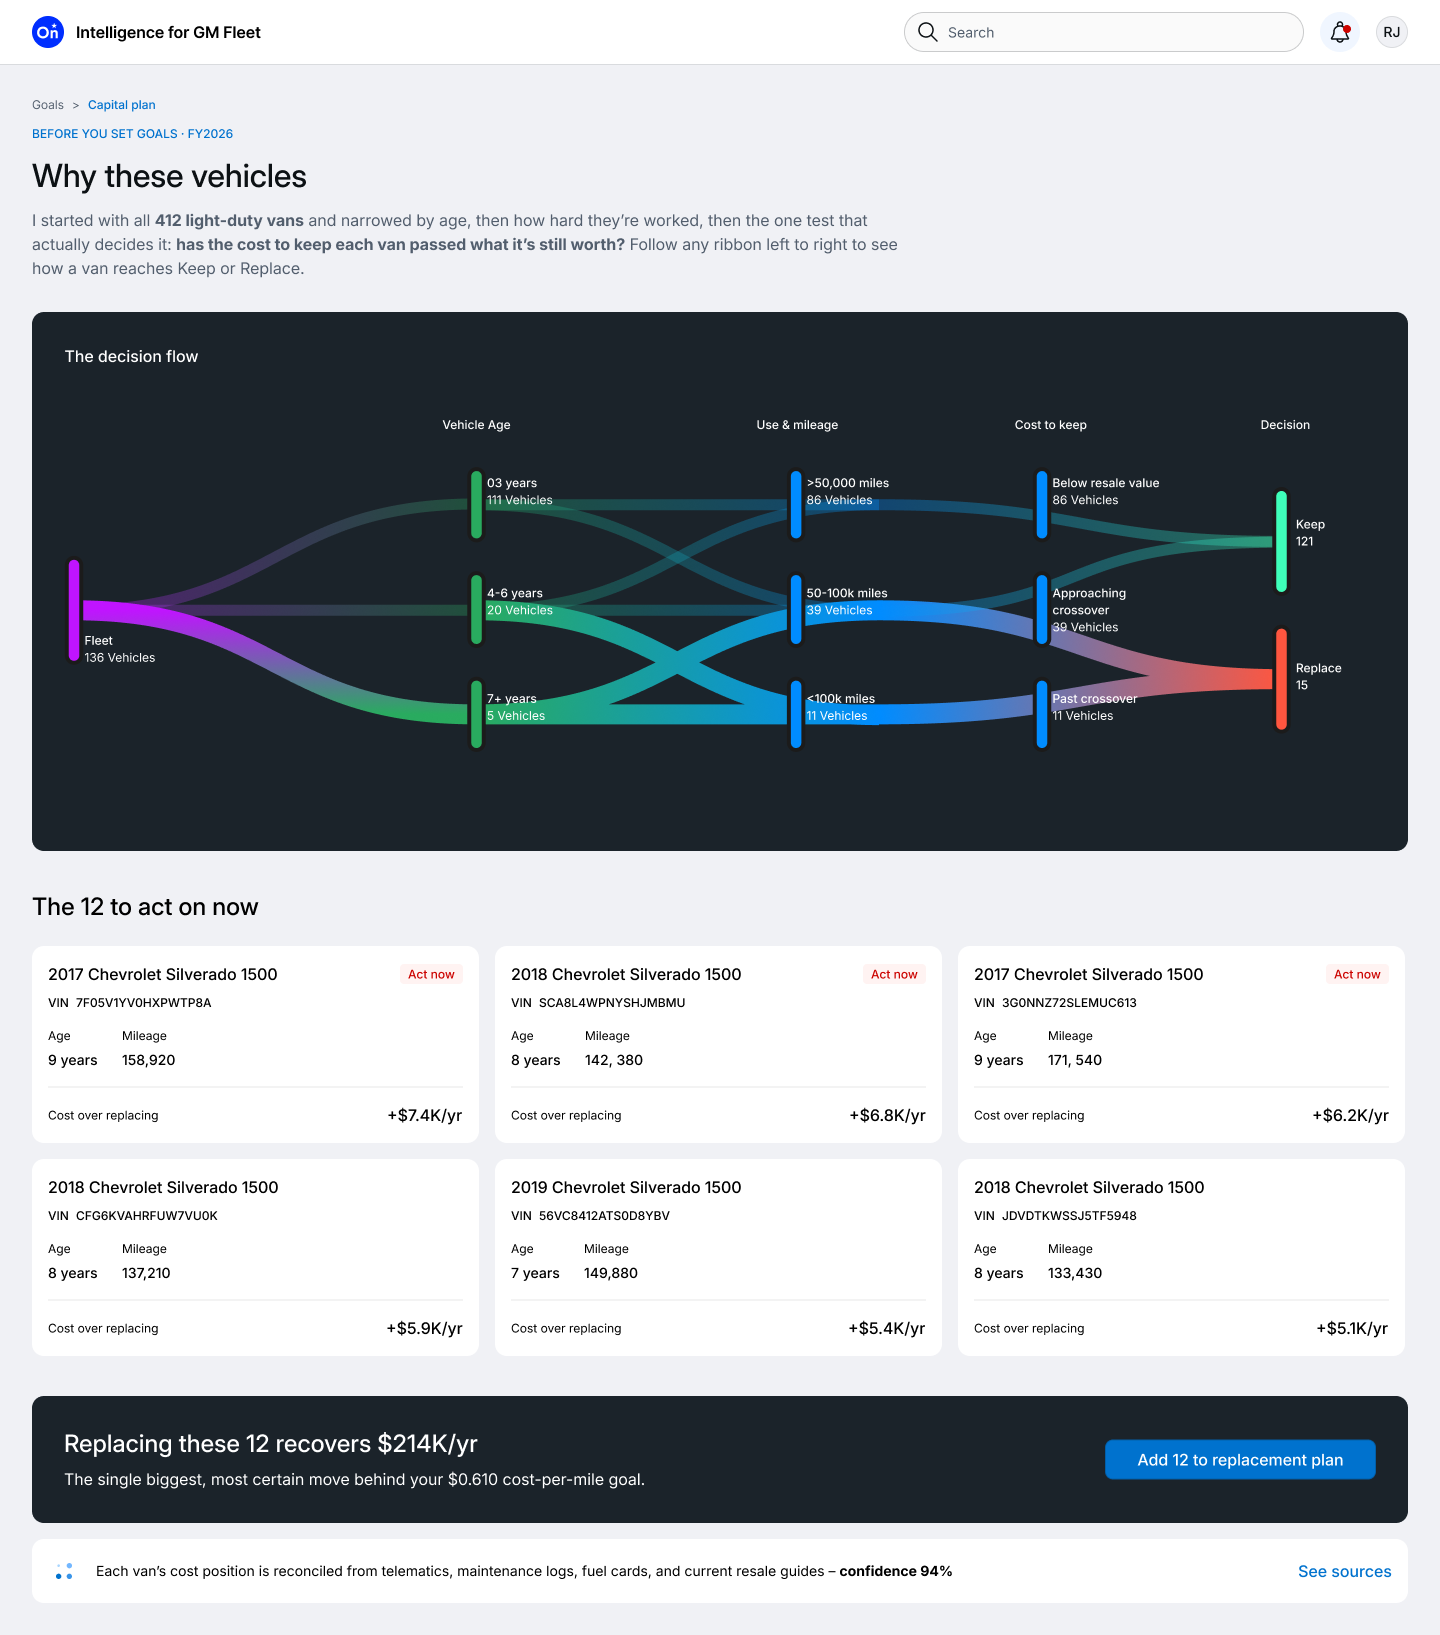
Nothing is hidden — a director can still drill into why specific vehicles are recommended for replacement. The old category breakdown — energy, safety, maintenance, and so on — didn't disappear. It moved from the headline to supporting detail further down the page, once the goal itself became the entry point.
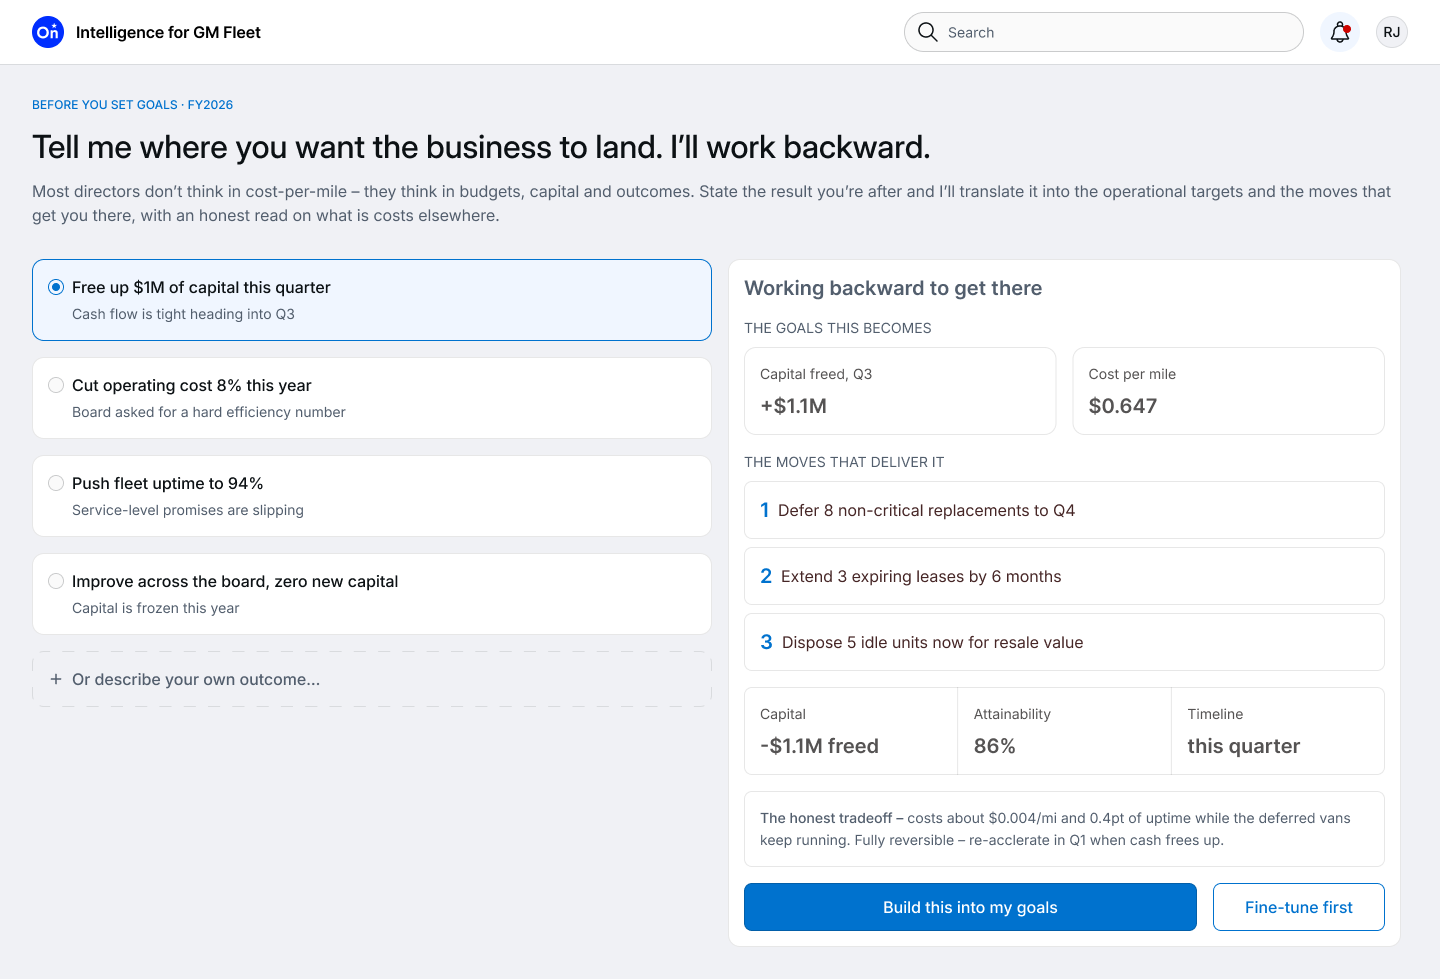
A shift in the question, not yet a shipped product.
I brought the reworked concept to a meeting with the director, my former manager, and my current manager and senior manager. The shift in perspective resonated enough that the group asked to keep developing it as part of the platform's long-term vision work.
The work remains conceptual rather than shipped, but it changed the conversation from "How can we present more information?" to "How can we help leaders make better decisions?" That distinction continues to shape how the team is thinking about what comes next.